What happens when one chain systematically performs better than others?
STAGE 11 · EXPANSION, CONSOLIDATION, AND MIGRATION OF FUNCTIONS
Expansion, consolidation, and migration of functions
At first, the difference is visible inside the company: a higher Availability Level, faster capital turnover, ordering and replenishment operating under common rules, and an assortment that changes with demand.
But what happens if these advantages operate simultaneously for many years?
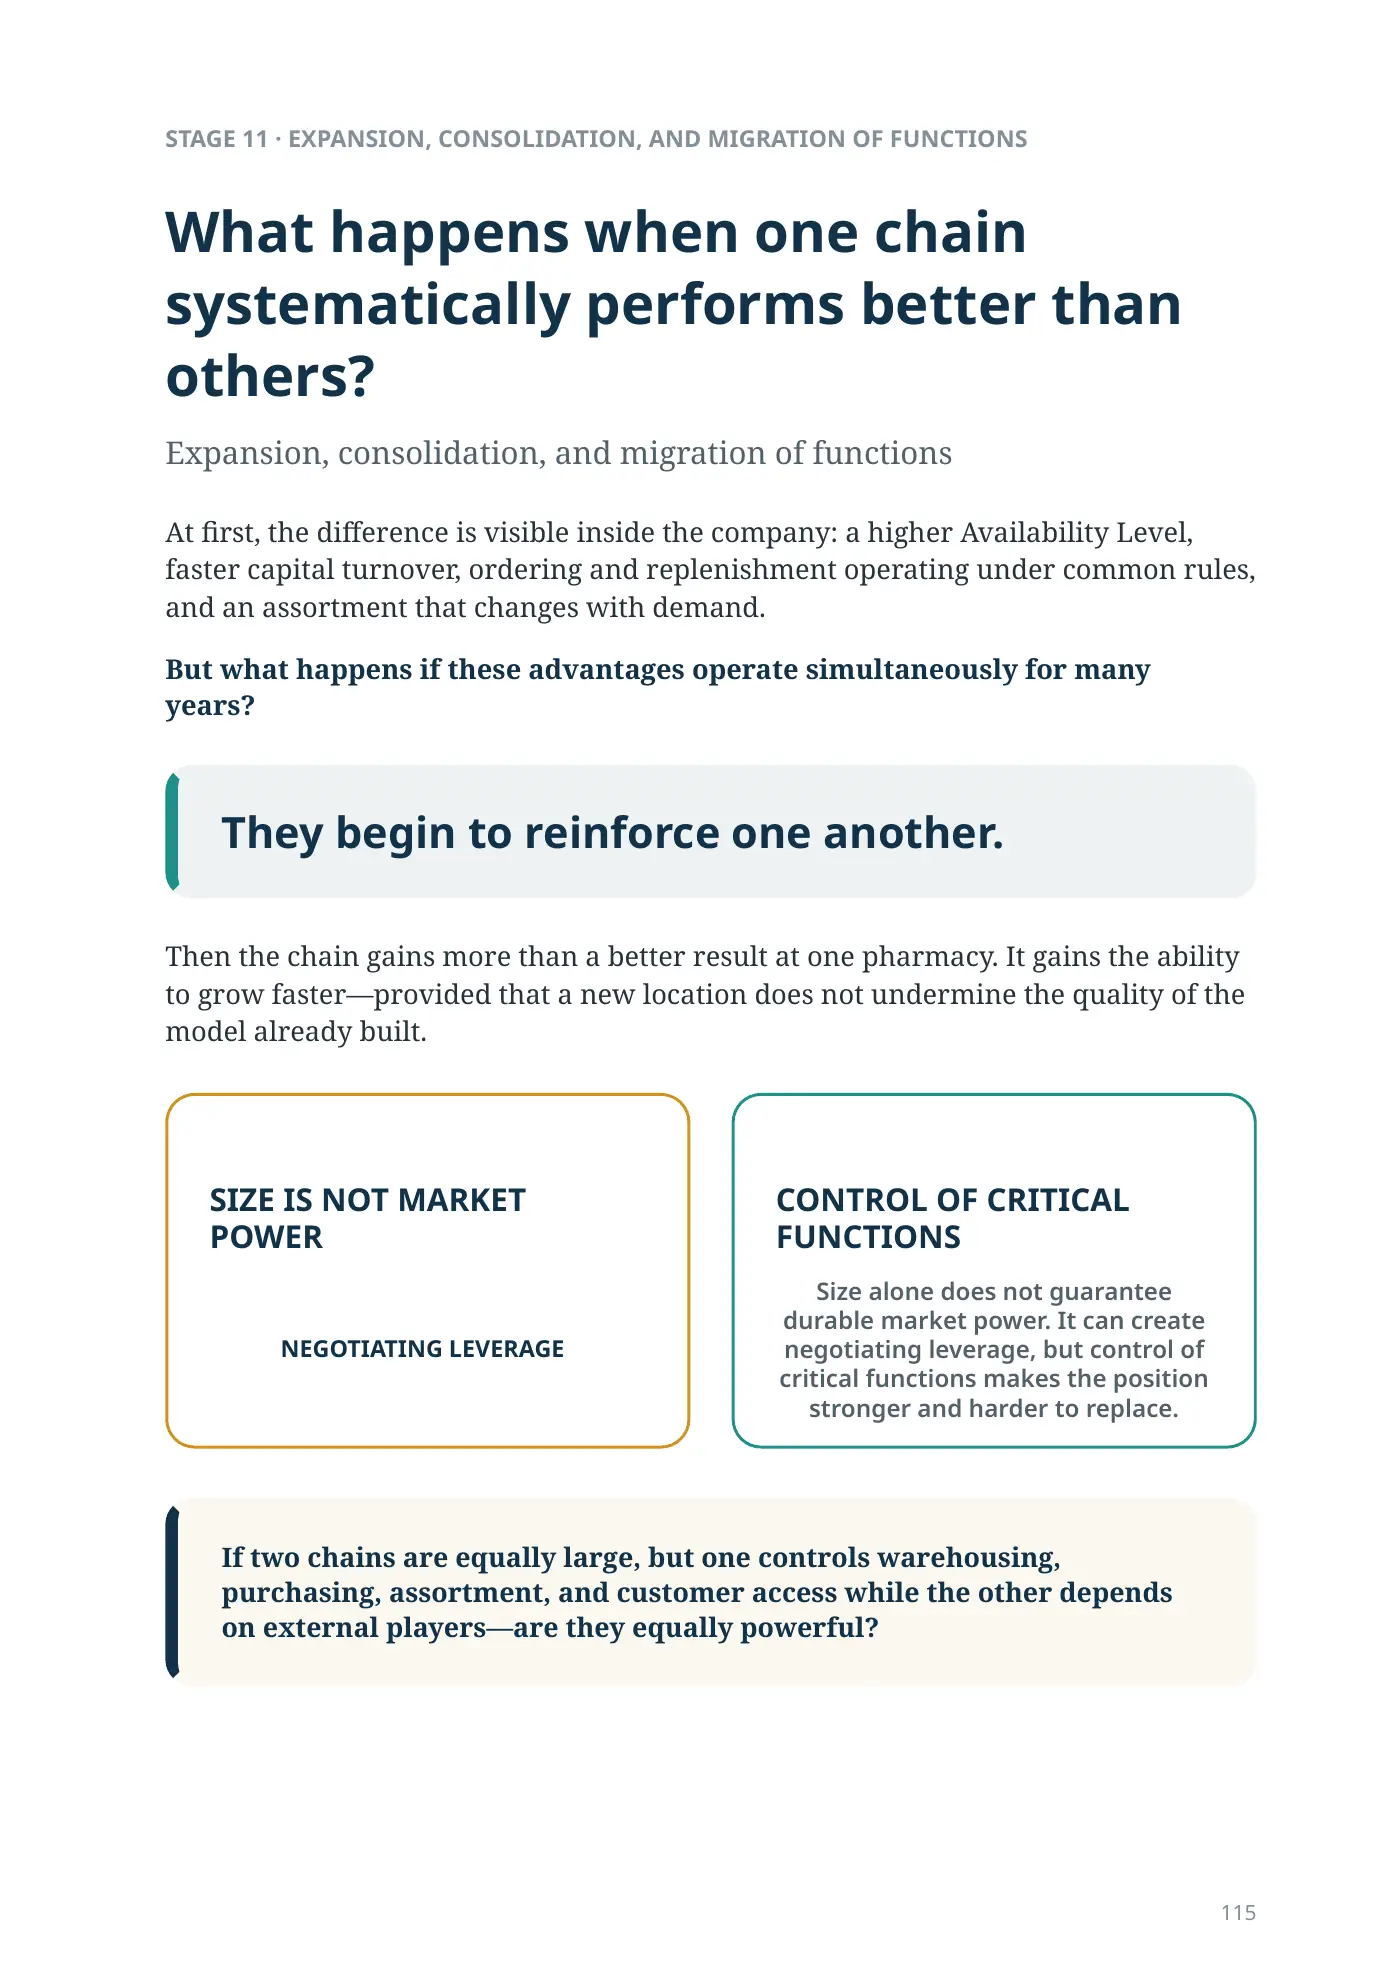
They begin to reinforce one another.
Then the chain gains more than a better result at one pharmacy. It gains the ability to grow faster—provided that a new location does not undermine the quality of the model already built.
SIZE IS NOT MARKET POWER
Size alone does not guarantee durable market power. It can create negotiating leverage, but control of critical functions makes the position stronger and harder to replace.
If two chains are equally large, but one controls warehousing, purchasing, assortment, and customer access while the other depends on external players—are they equally powerful?
NEGOTIATING LEVERAGECONTROL OF CRITICAL FUNCTIONSTHE ACCELERATION POINT
Build the machine first. Then step on the gas
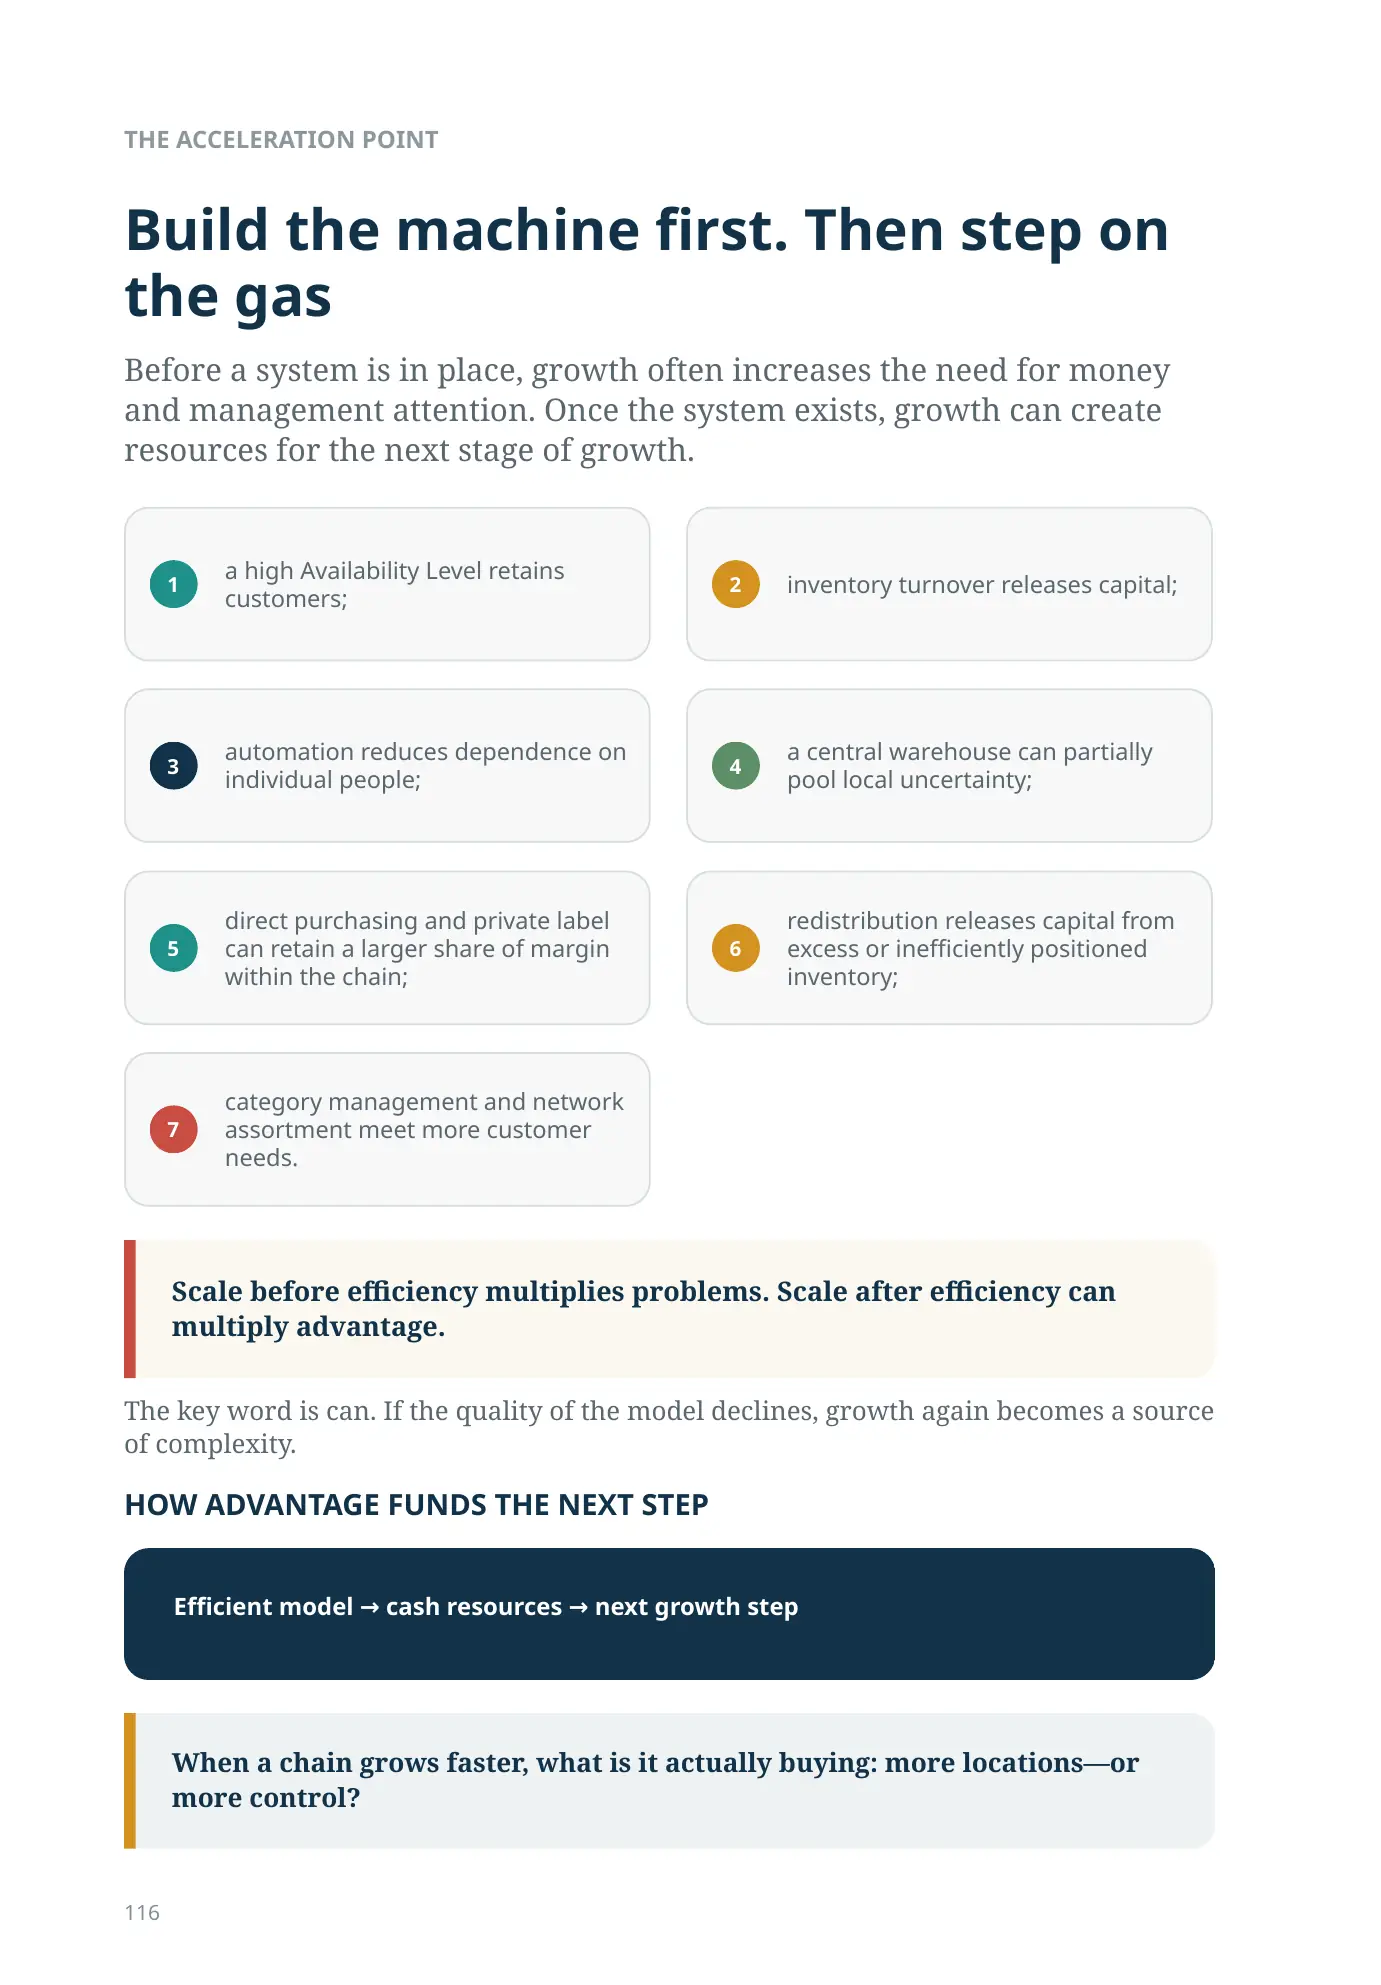
Before a system is in place, growth often increases the need for money and management attention. Once the system exists, growth can create resources for the next stage of growth.
- a high Availability Level retains customers;
- inventory turnover releases capital;
- automation reduces dependence on individual people;
- a central warehouse can partially pool local uncertainty;
- direct purchasing and private label can retain a larger share of margin within the chain;
- redistribution releases capital from excess or
inefficiently positioned inventory;
- category management and network assortment meet more customer needs.
Scale before efficiency multiplies problems. Scale after efficiency can multiply advantage.
The key word is can. If the quality of the model declines, growth again becomes a source of complexity.
HOW ADVANTAGE FUNDS THE NEXT STEP
Efficient model → cash resources → next growth step
When a chain grows faster, what is it actually buying: more locations—or more control?
1234567TWO PATHS TO EXPANSION
Build locations yourself or buy existing customer traffic?
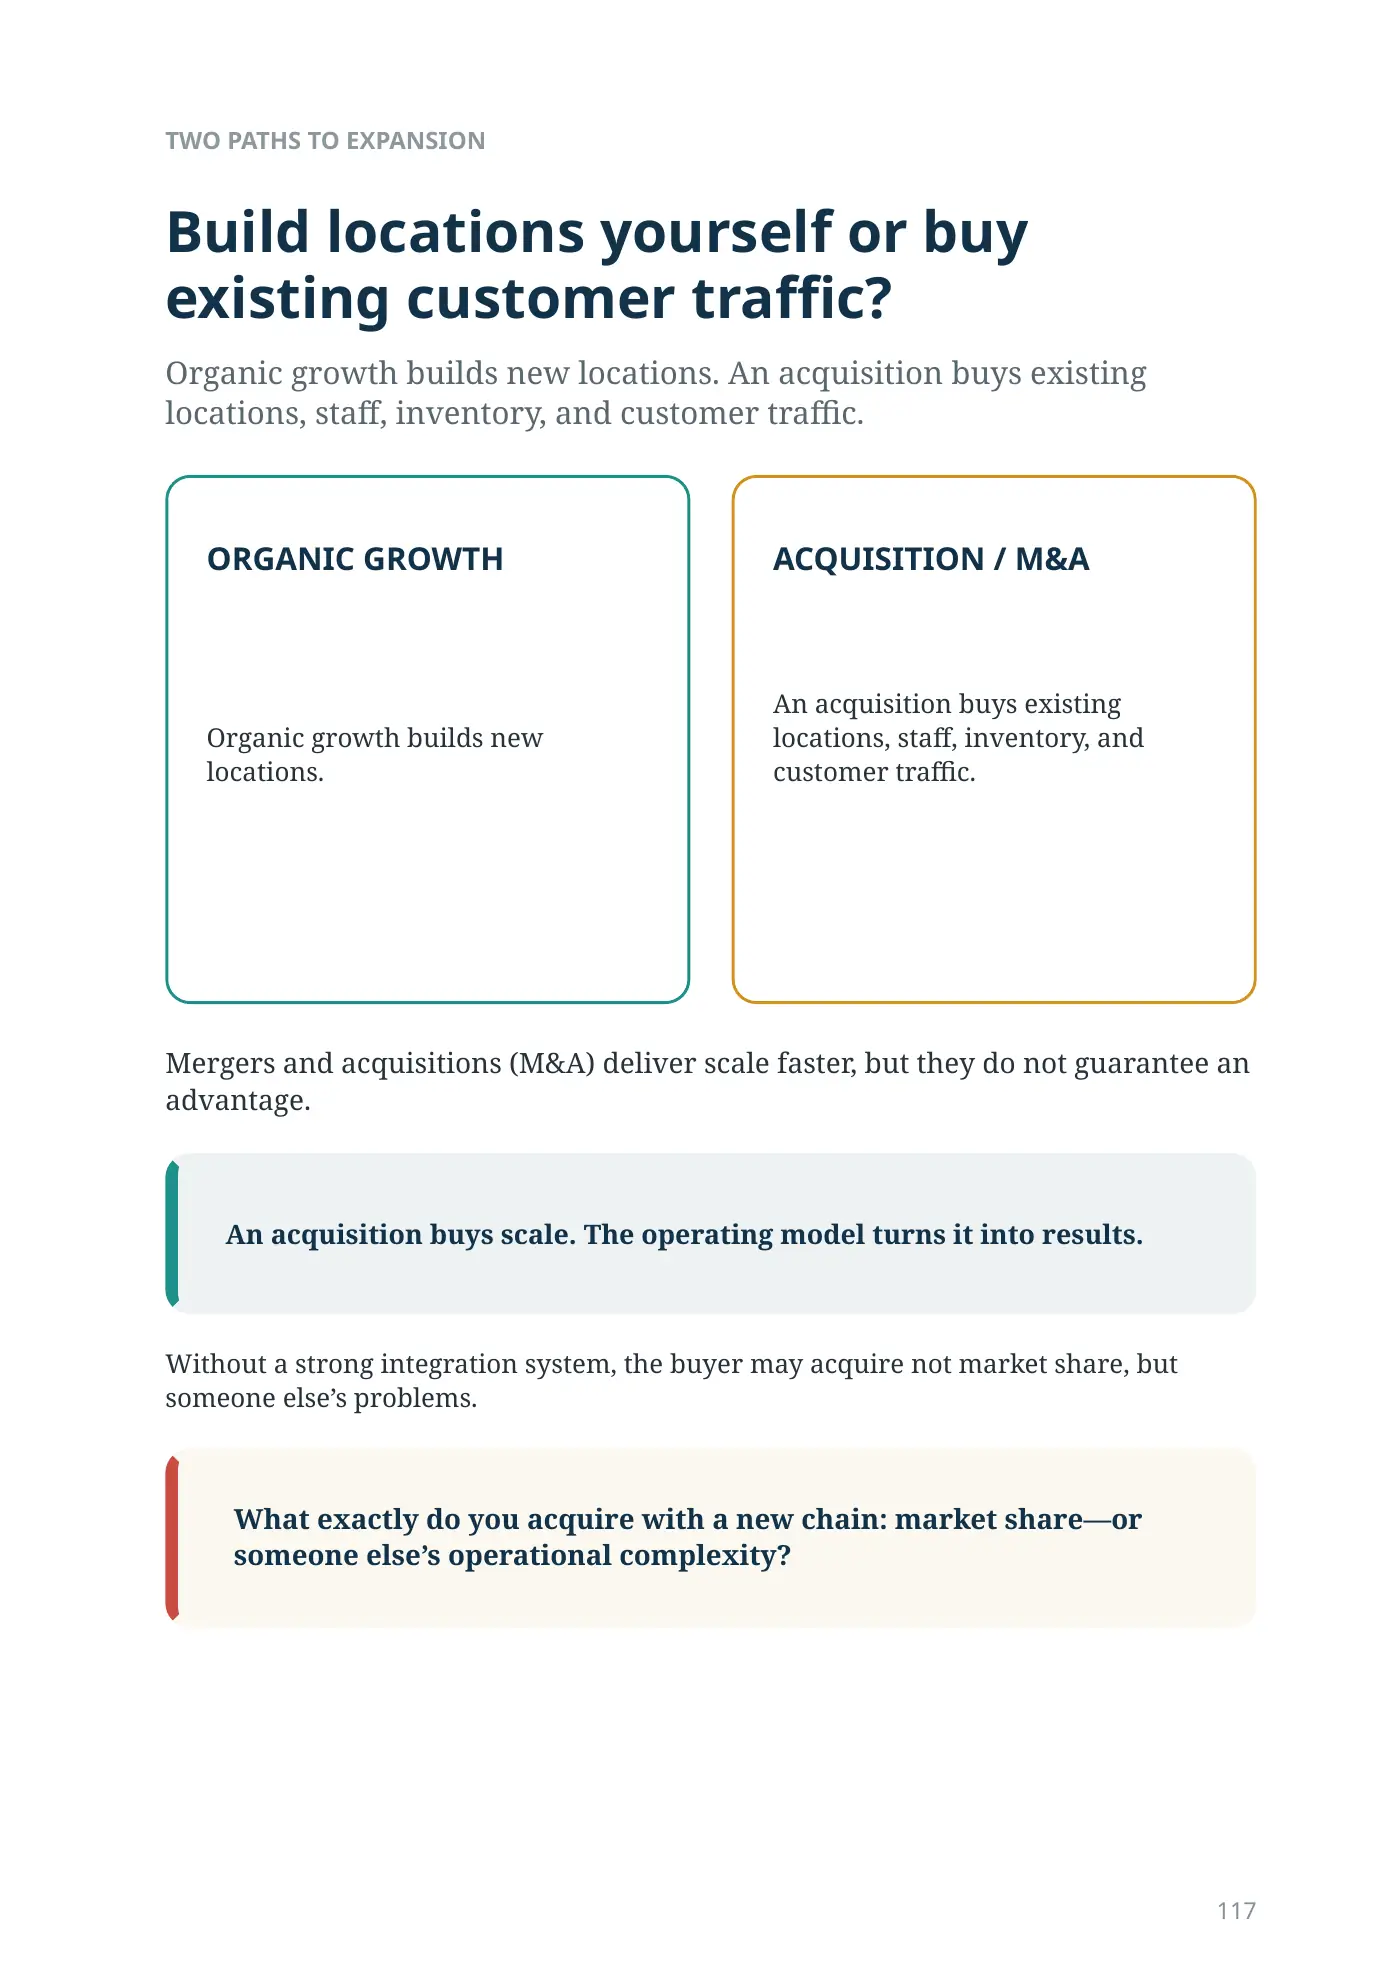
Organic growth builds new locations. An acquisition buys existing locations, staff, inventory, and customer traffic.
Mergers and acquisitions (M&A) deliver scale faster, but they do not guarantee an advantage.
An acquisition buys scale. The operating model turns it into results.
Without a strong integration system, the buyer may acquire not market share, but someone else’s problems.
What exactly do you acquire with a new chain: market share—or someone else’s operational complexity?
MIGRATION OF FUNCTIONS
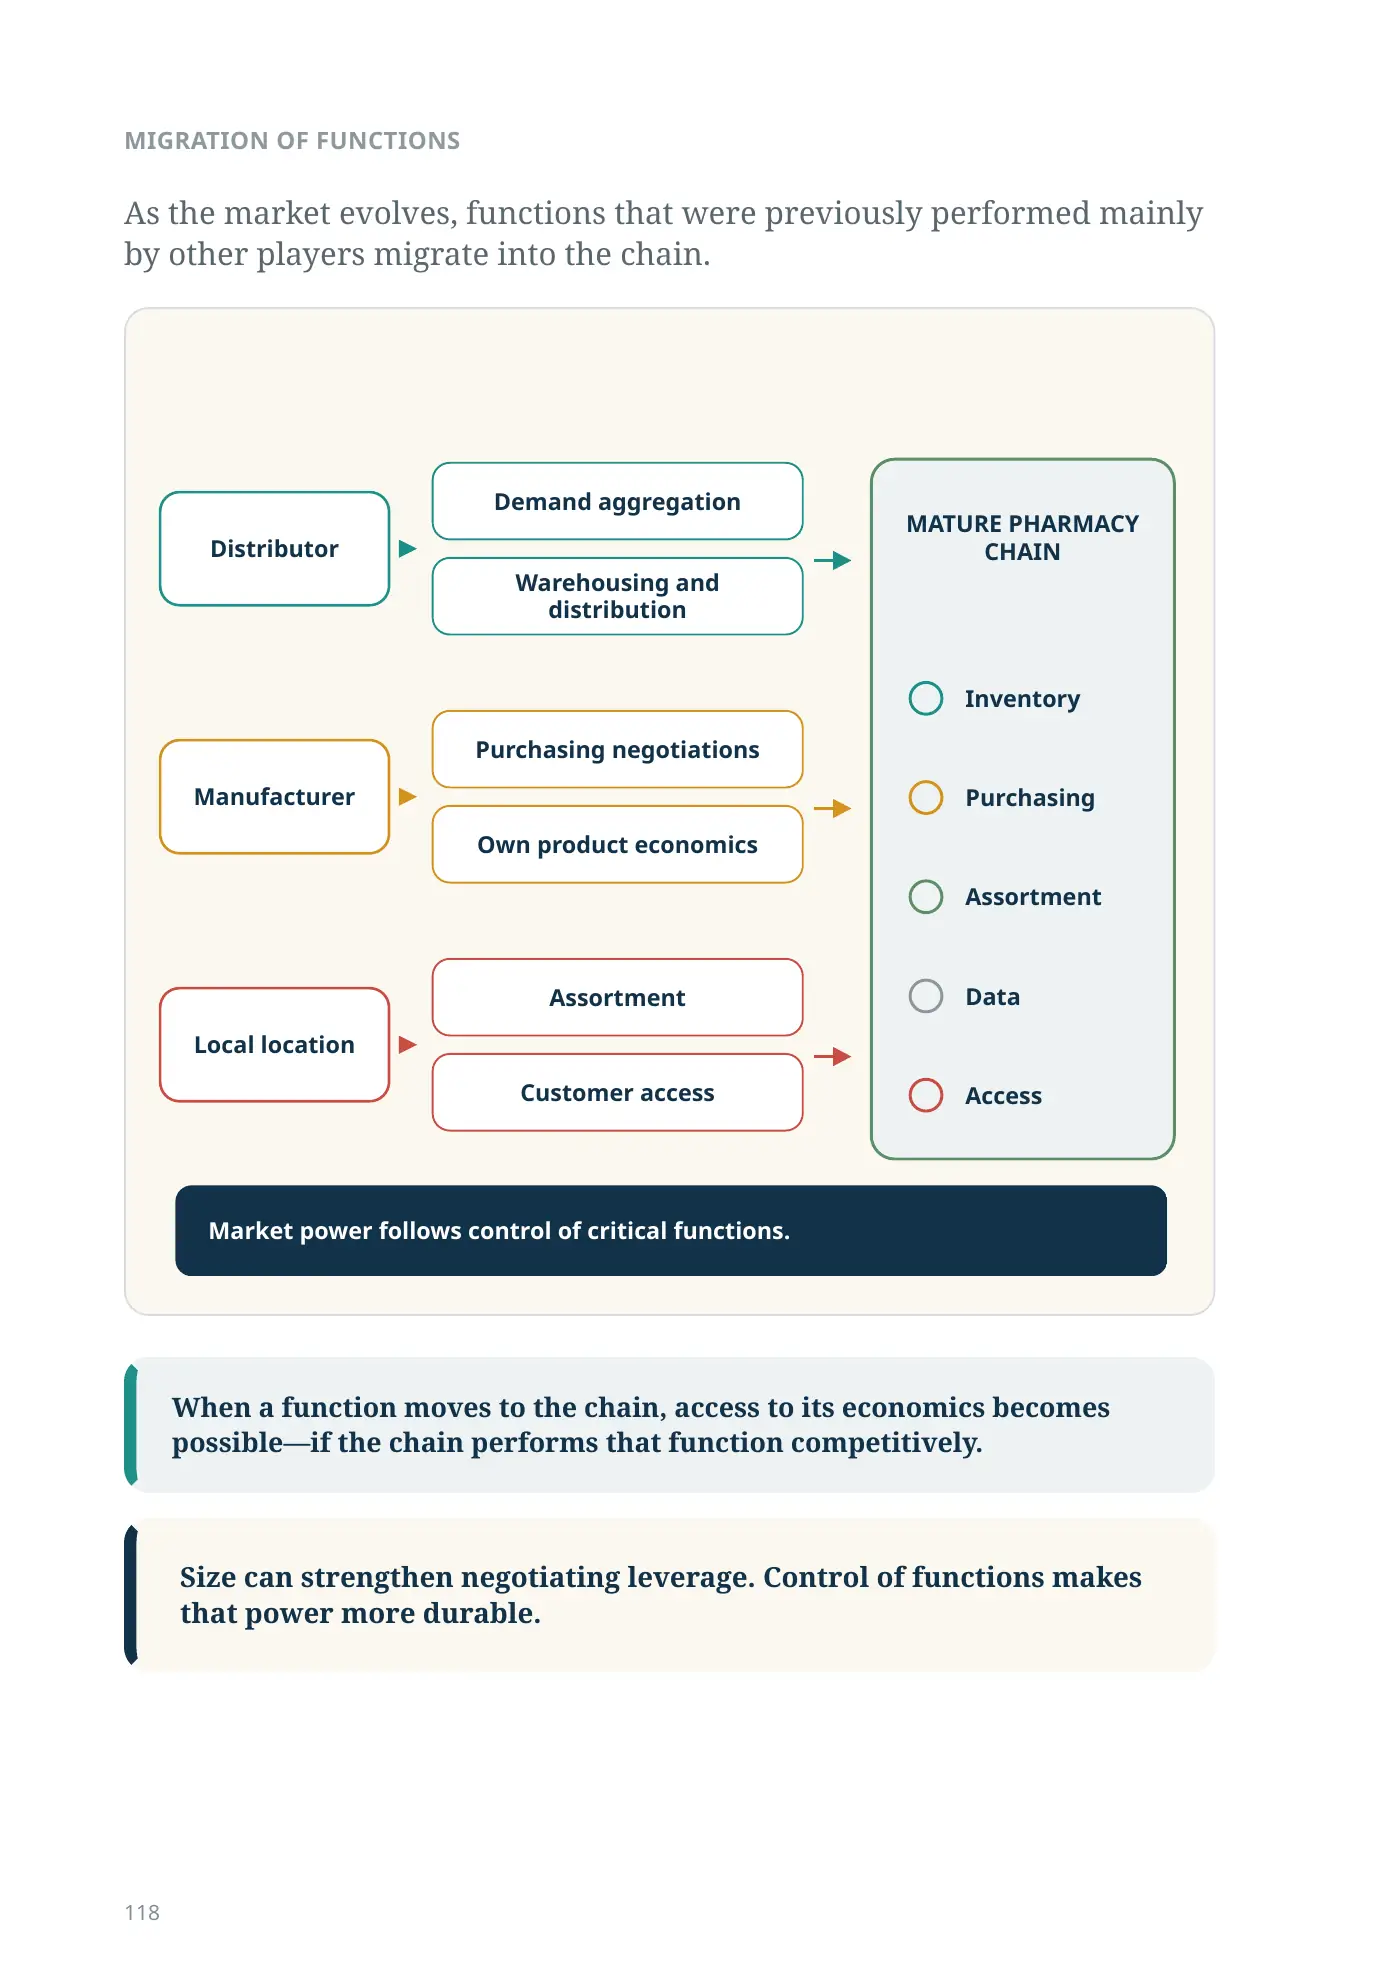
As the market evolves, functions that were previously performed mainly by other players migrate into the chain.
When a function moves to the chain, access to its economics becomes possible—if the chain performs that function competitively.
Size can strengthen negotiating leverage. Control of functions makes that power more durable.
Functions that migrate into a mature chain
- Distributor
- Manufacturer
- Local location
- Inventory
- Purchasing
- Assortment
- Data
- Access
Market power follows control of critical functions.
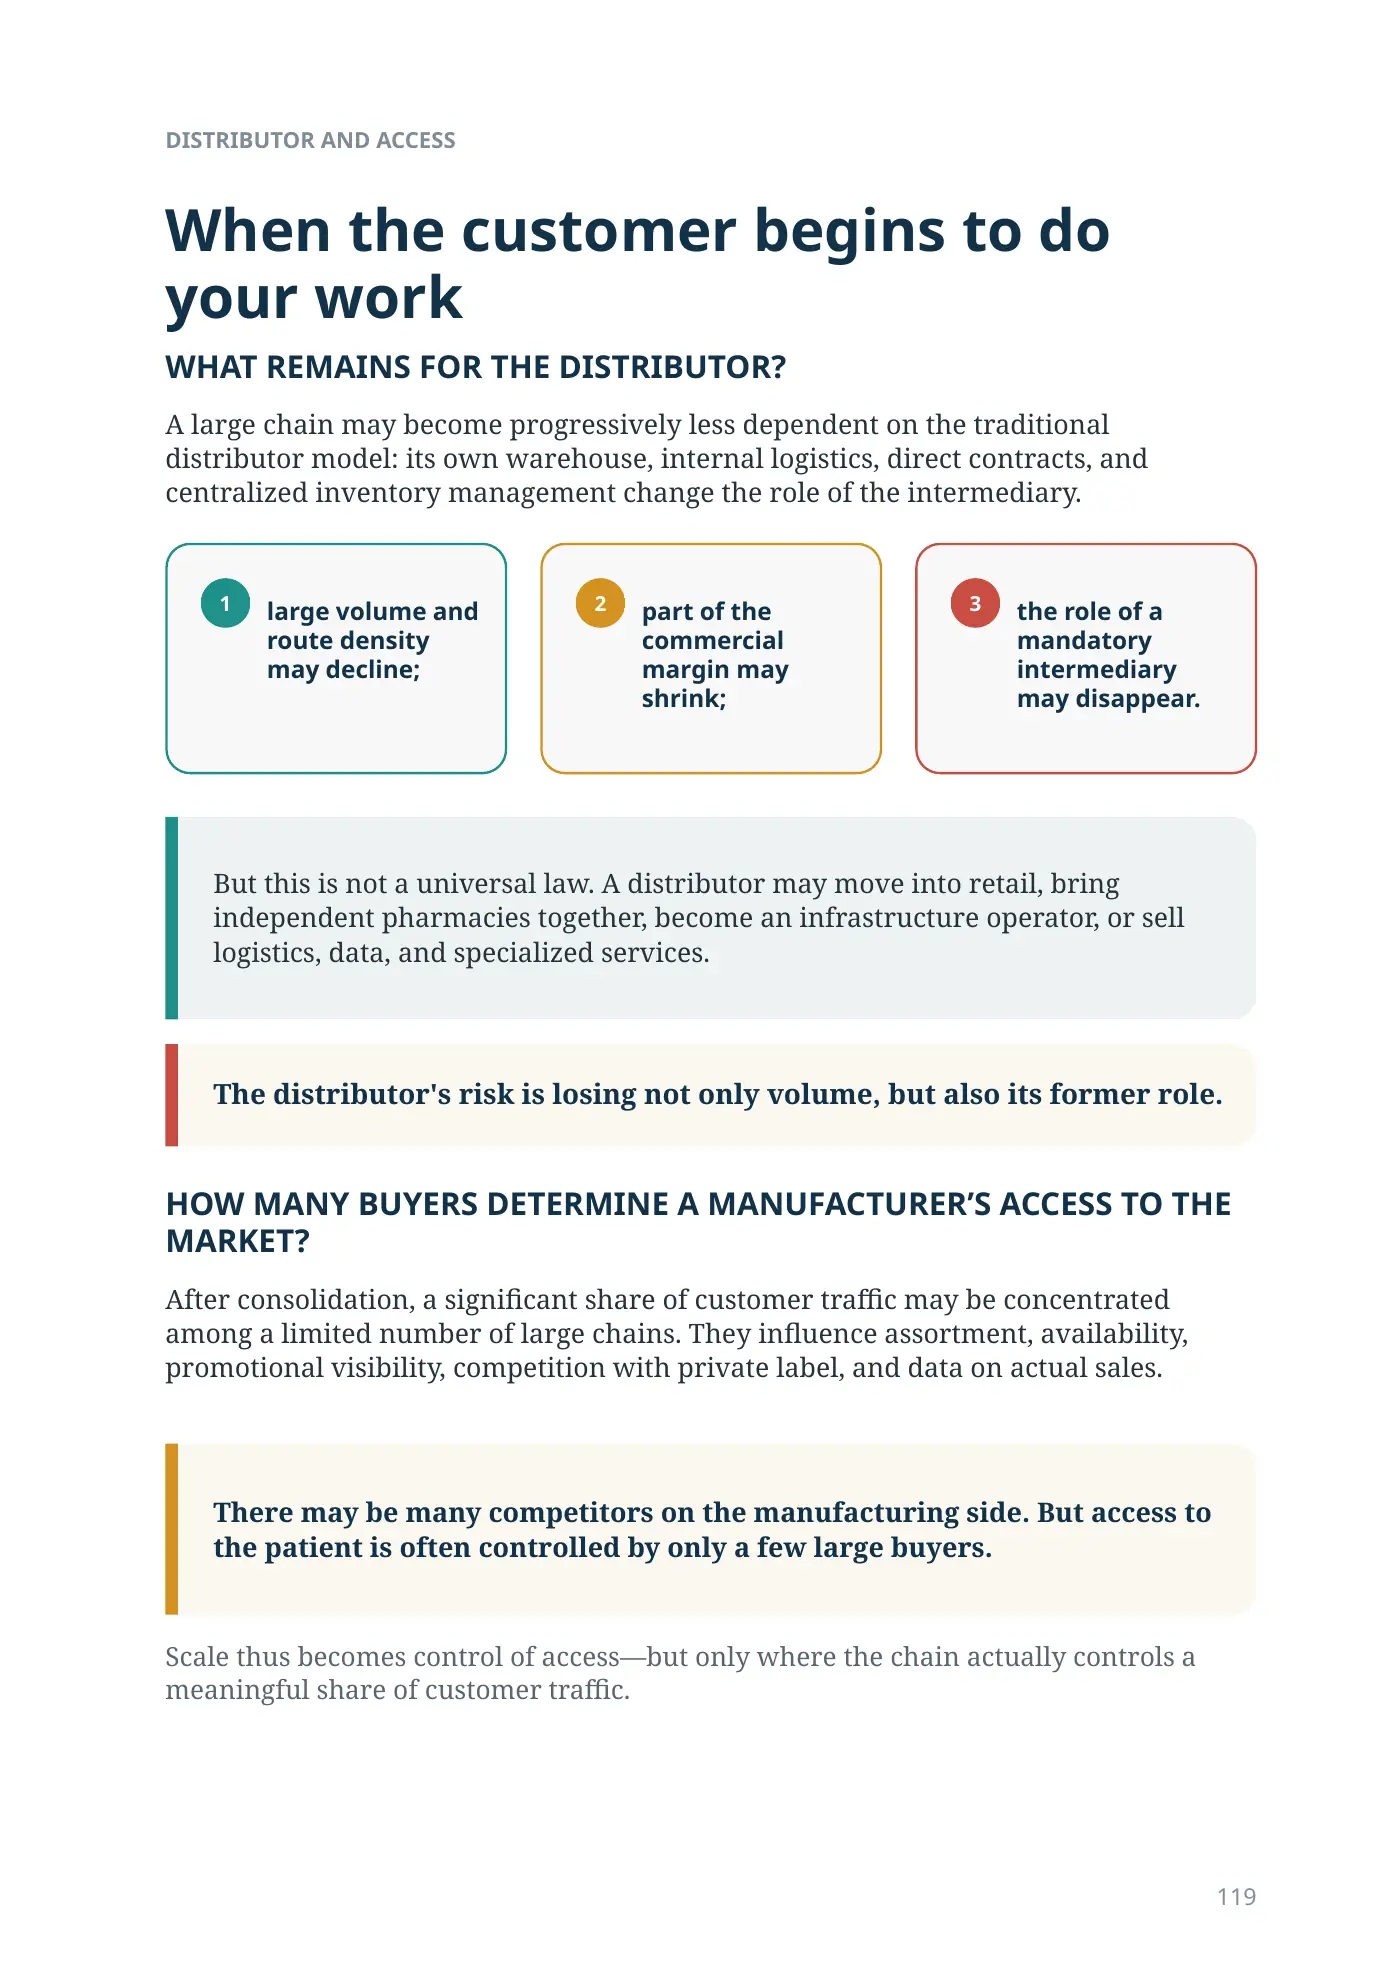
When the customer begins to do your work
WHAT REMAINS FOR THE DISTRIBUTOR?
A large chain may become progressively less dependent on the traditional distributor model: its own warehouse, internal logistics, direct contracts, and centralized inventory management change the role of the intermediary.
- large volume and route density may decline;
- part of the commercial margin may shrink;
- the role of a mandatory intermediary may disappear.
But this is not a universal law. A distributor may move into retail, bring independent pharmacies together, become an infrastructure operator, or sell logistics, data, and specialized services.
The distributor's risk is losing not only volume, but also its former role.
HOW MANY BUYERS DETERMINE A MANUFACTURER’S ACCESS TO THE MARKET?
After consolidation, a significant share of customer traffic may be concentrated among a limited number of large chains. They influence assortment, availability, promotional visibility, competition with private label, and data on actual sales.
There may be many competitors on the manufacturing side. But access to the patient is often controlled by only a few large buyers.
Scale thus becomes control of access—but only where the chain actually controls a meaningful share of customer traffic.
123DISTRIBUTOR AND ACCESS
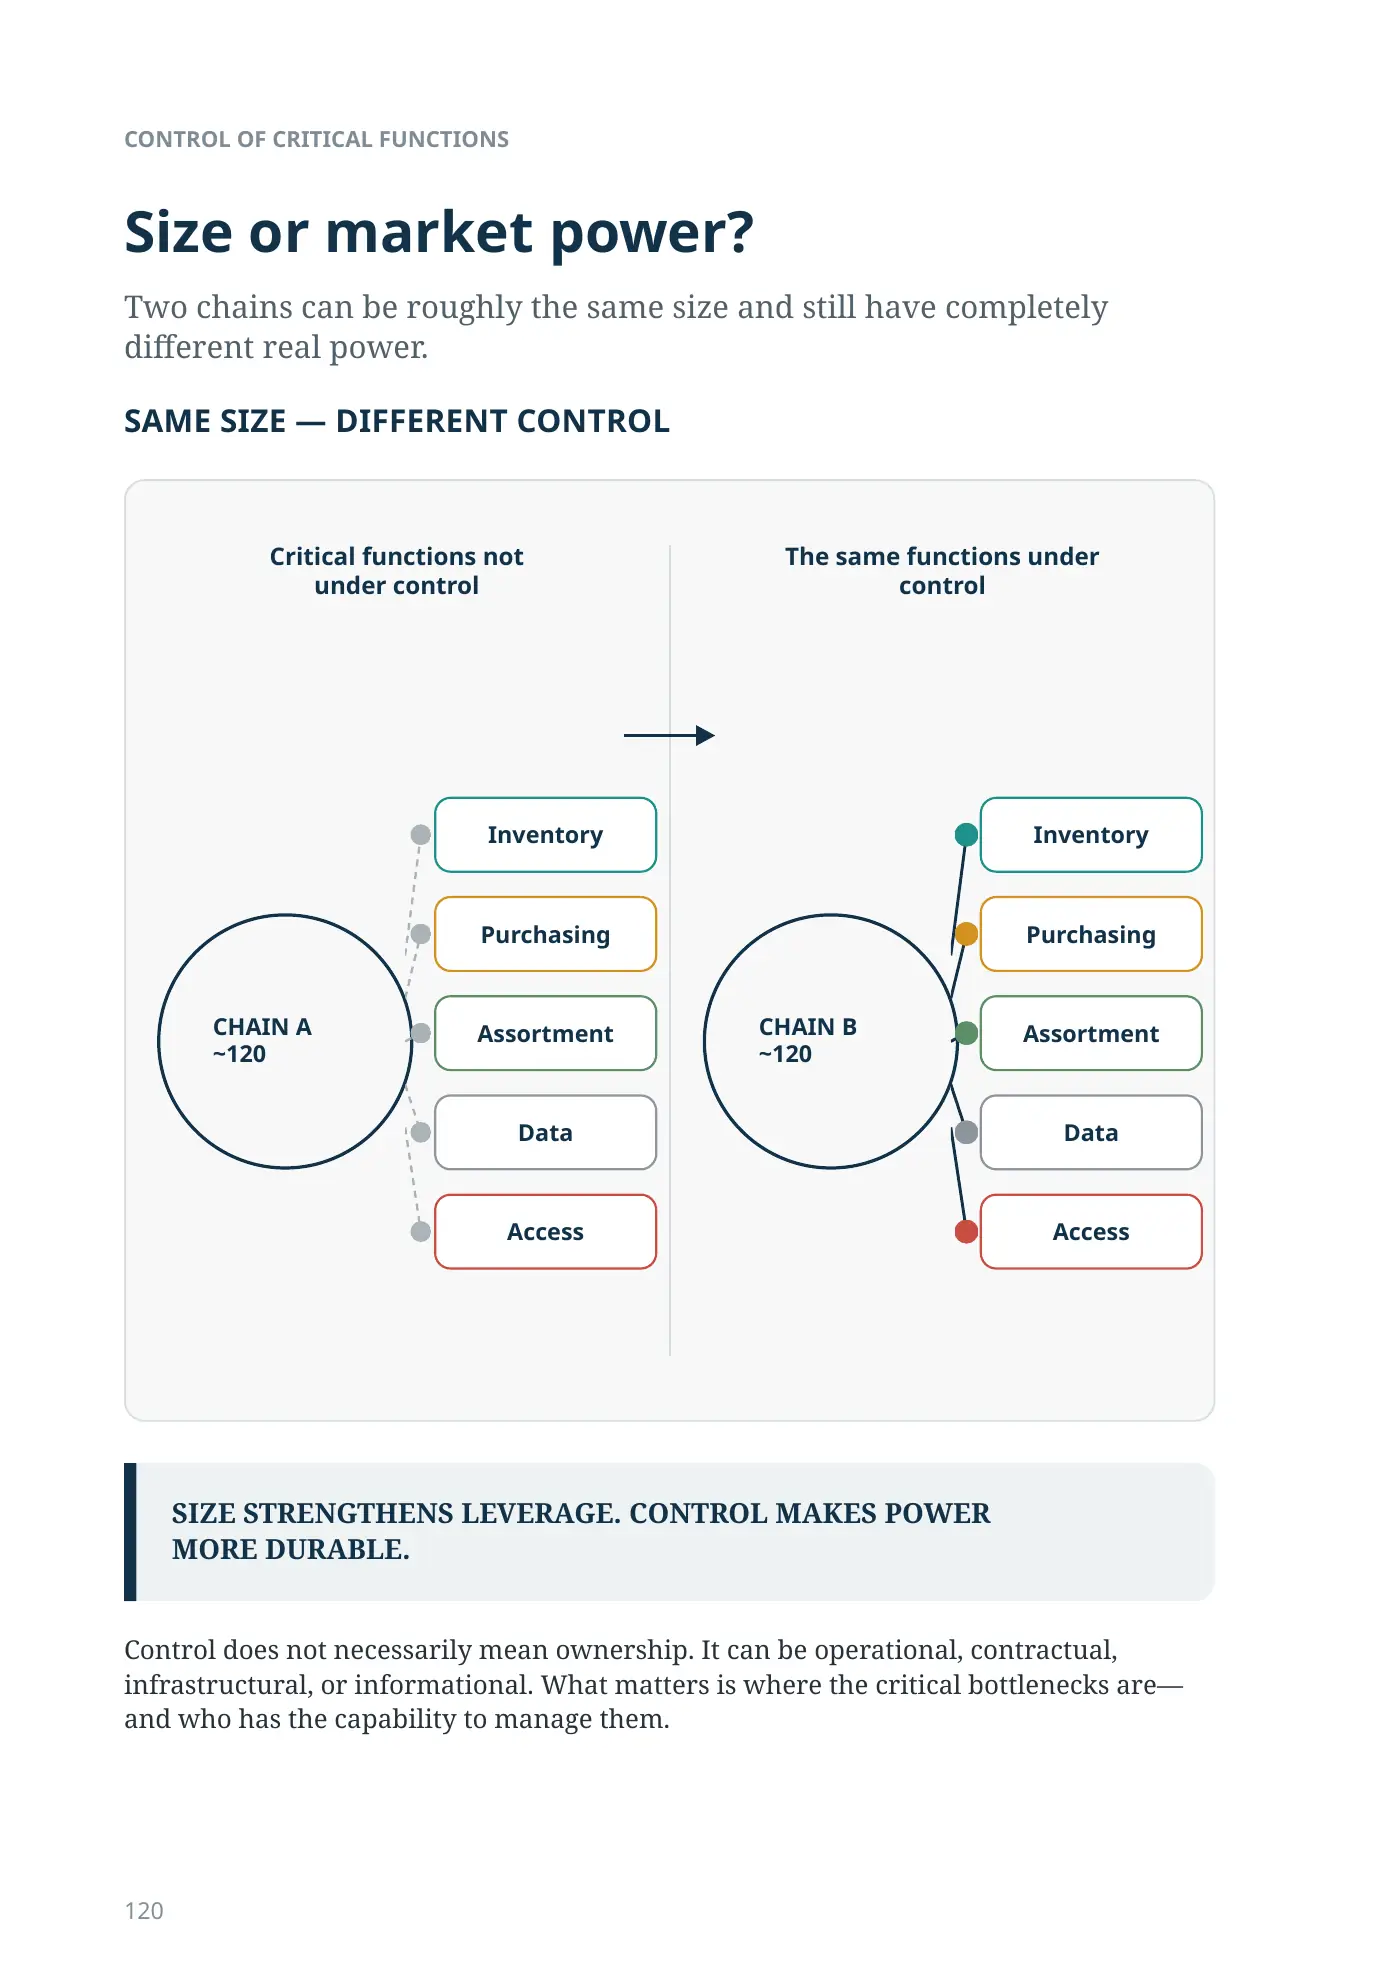
Size or market power?
Two chains can be roughly the same size and still have completely different real power.
Control does not necessarily mean ownership. It can be operational, contractual, infrastructural, or informational. What matters is where the critical bottlenecks are—and who has the capability to manage them.
SAME SIZE — DIFFERENT CONTROL
Critical functions not under control
- Inventory
- Purchasing
- Assortment
- Data
- Access
The same functions under control
- Inventory
- Purchasing
- Assortment
- Data
- Access
SIZE STRENGTHENS LEVERAGE. CONTROL MAKES POWER MORE DURABLE.
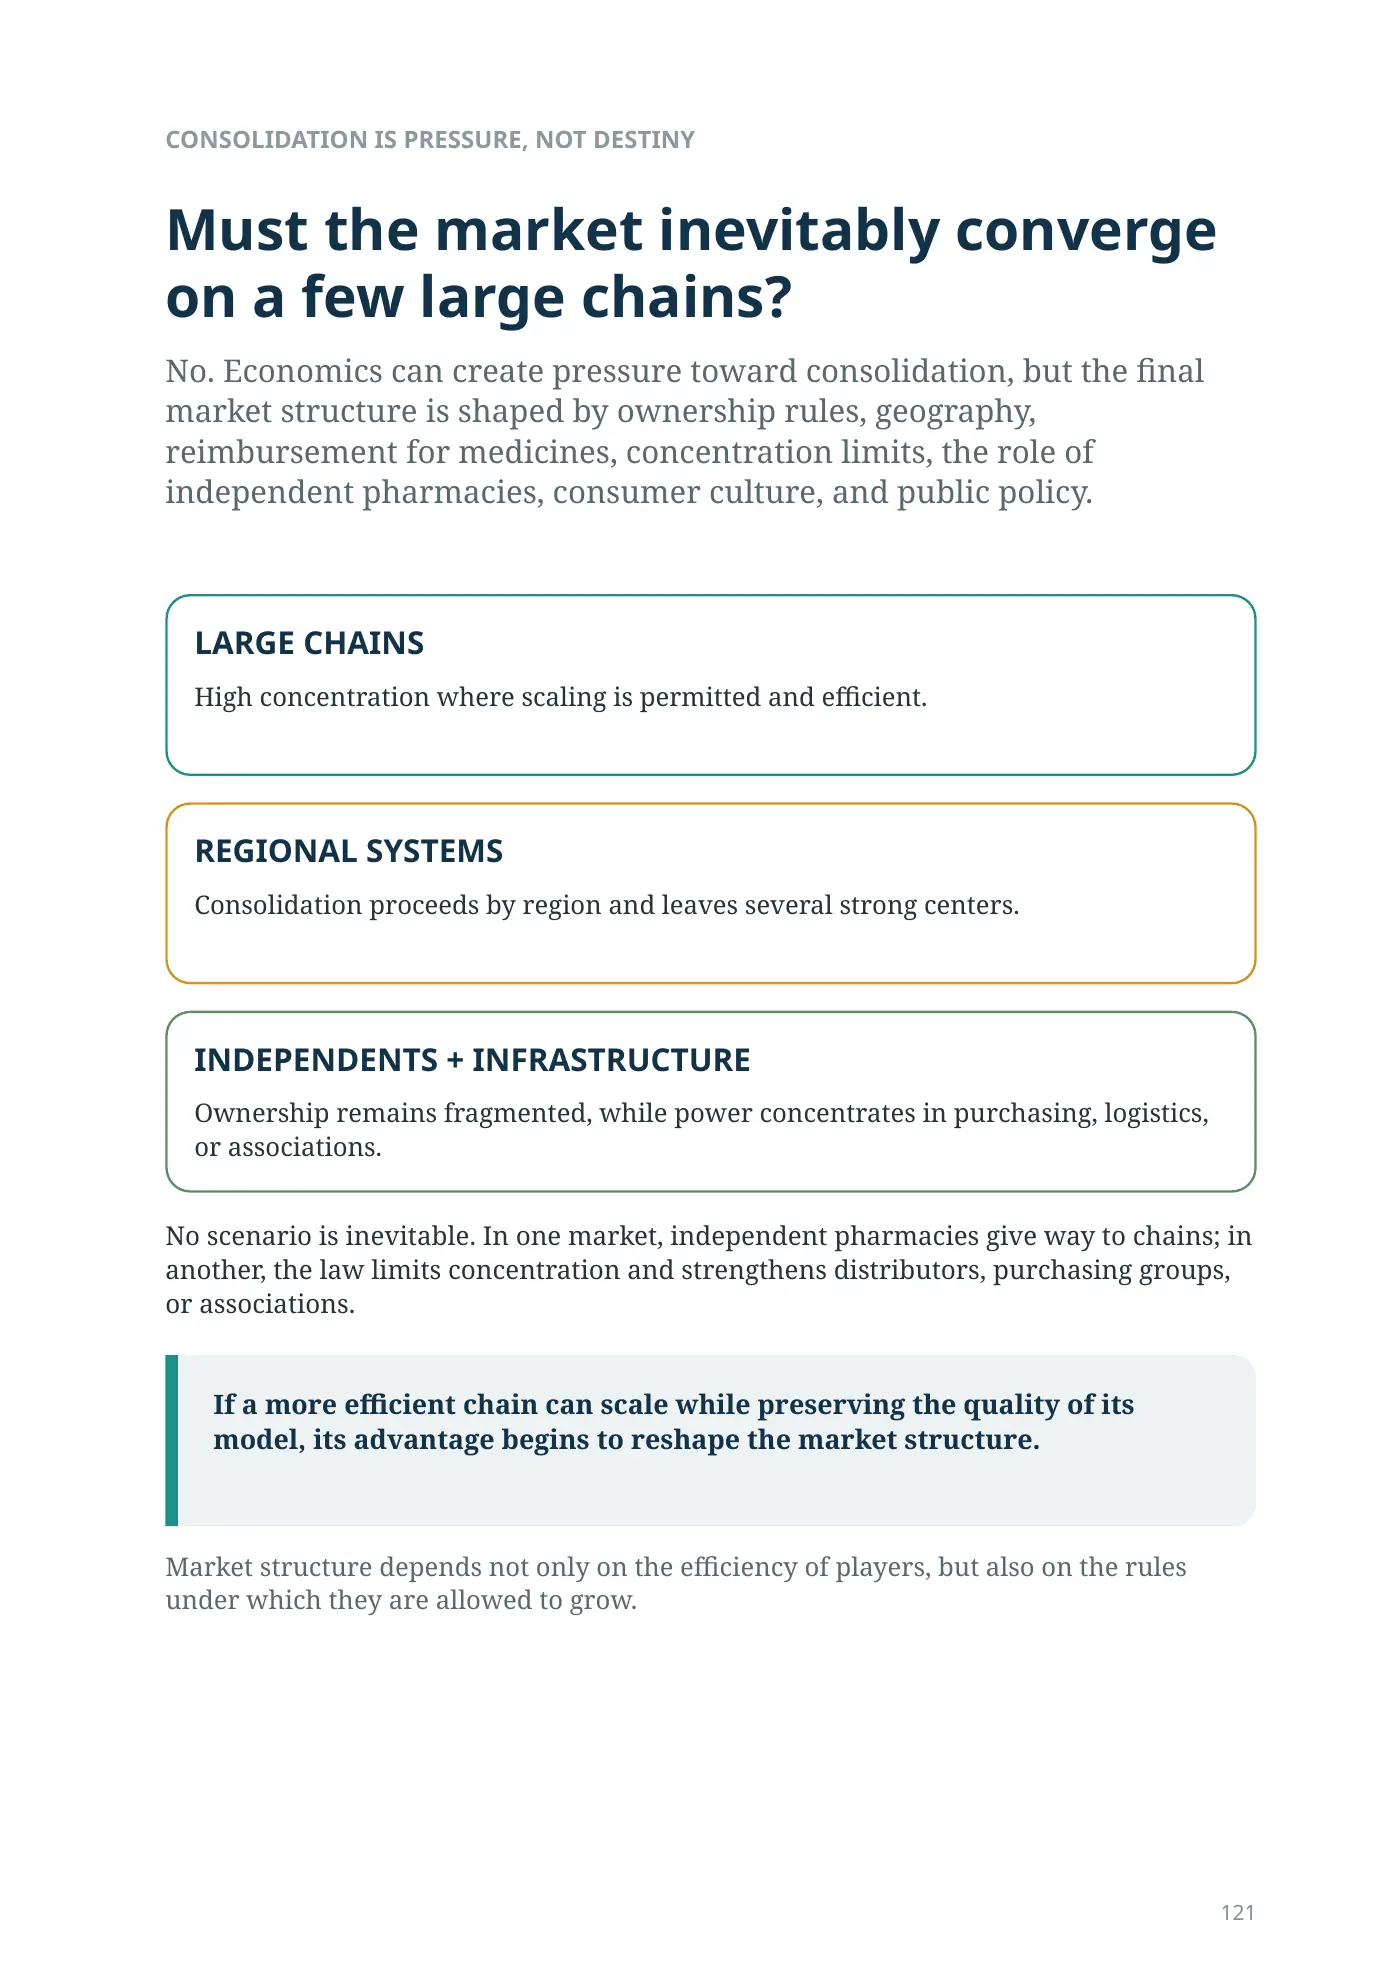
CONSOLIDATION IS PRESSURE, NOT DESTINY
Must the market inevitably converge on a few large chains?
No. Economics can create pressure toward consolidation, but the final market structure is shaped by ownership rules, geography, reimbursement for medicines, concentration limits, the role of independent pharmacies, consumer culture, and public policy.
High concentration where scaling is permitted and efficient.
Consolidation proceeds by region and leaves several strong centers.
Ownership remains fragmented, while power concentrates in purchasing, logistics, or associations.
No scenario is inevitable. In one market, independent pharmacies give way to chains; in another, the law limits concentration and strengthens distributors, purchasing groups, or associations.
If a more efficient chain can scale while preserving the quality of its model, its advantage begins to reshape the market structure.
Market structure depends not only on the efficiency of players, but also on the rules under which they are allowed to grow.
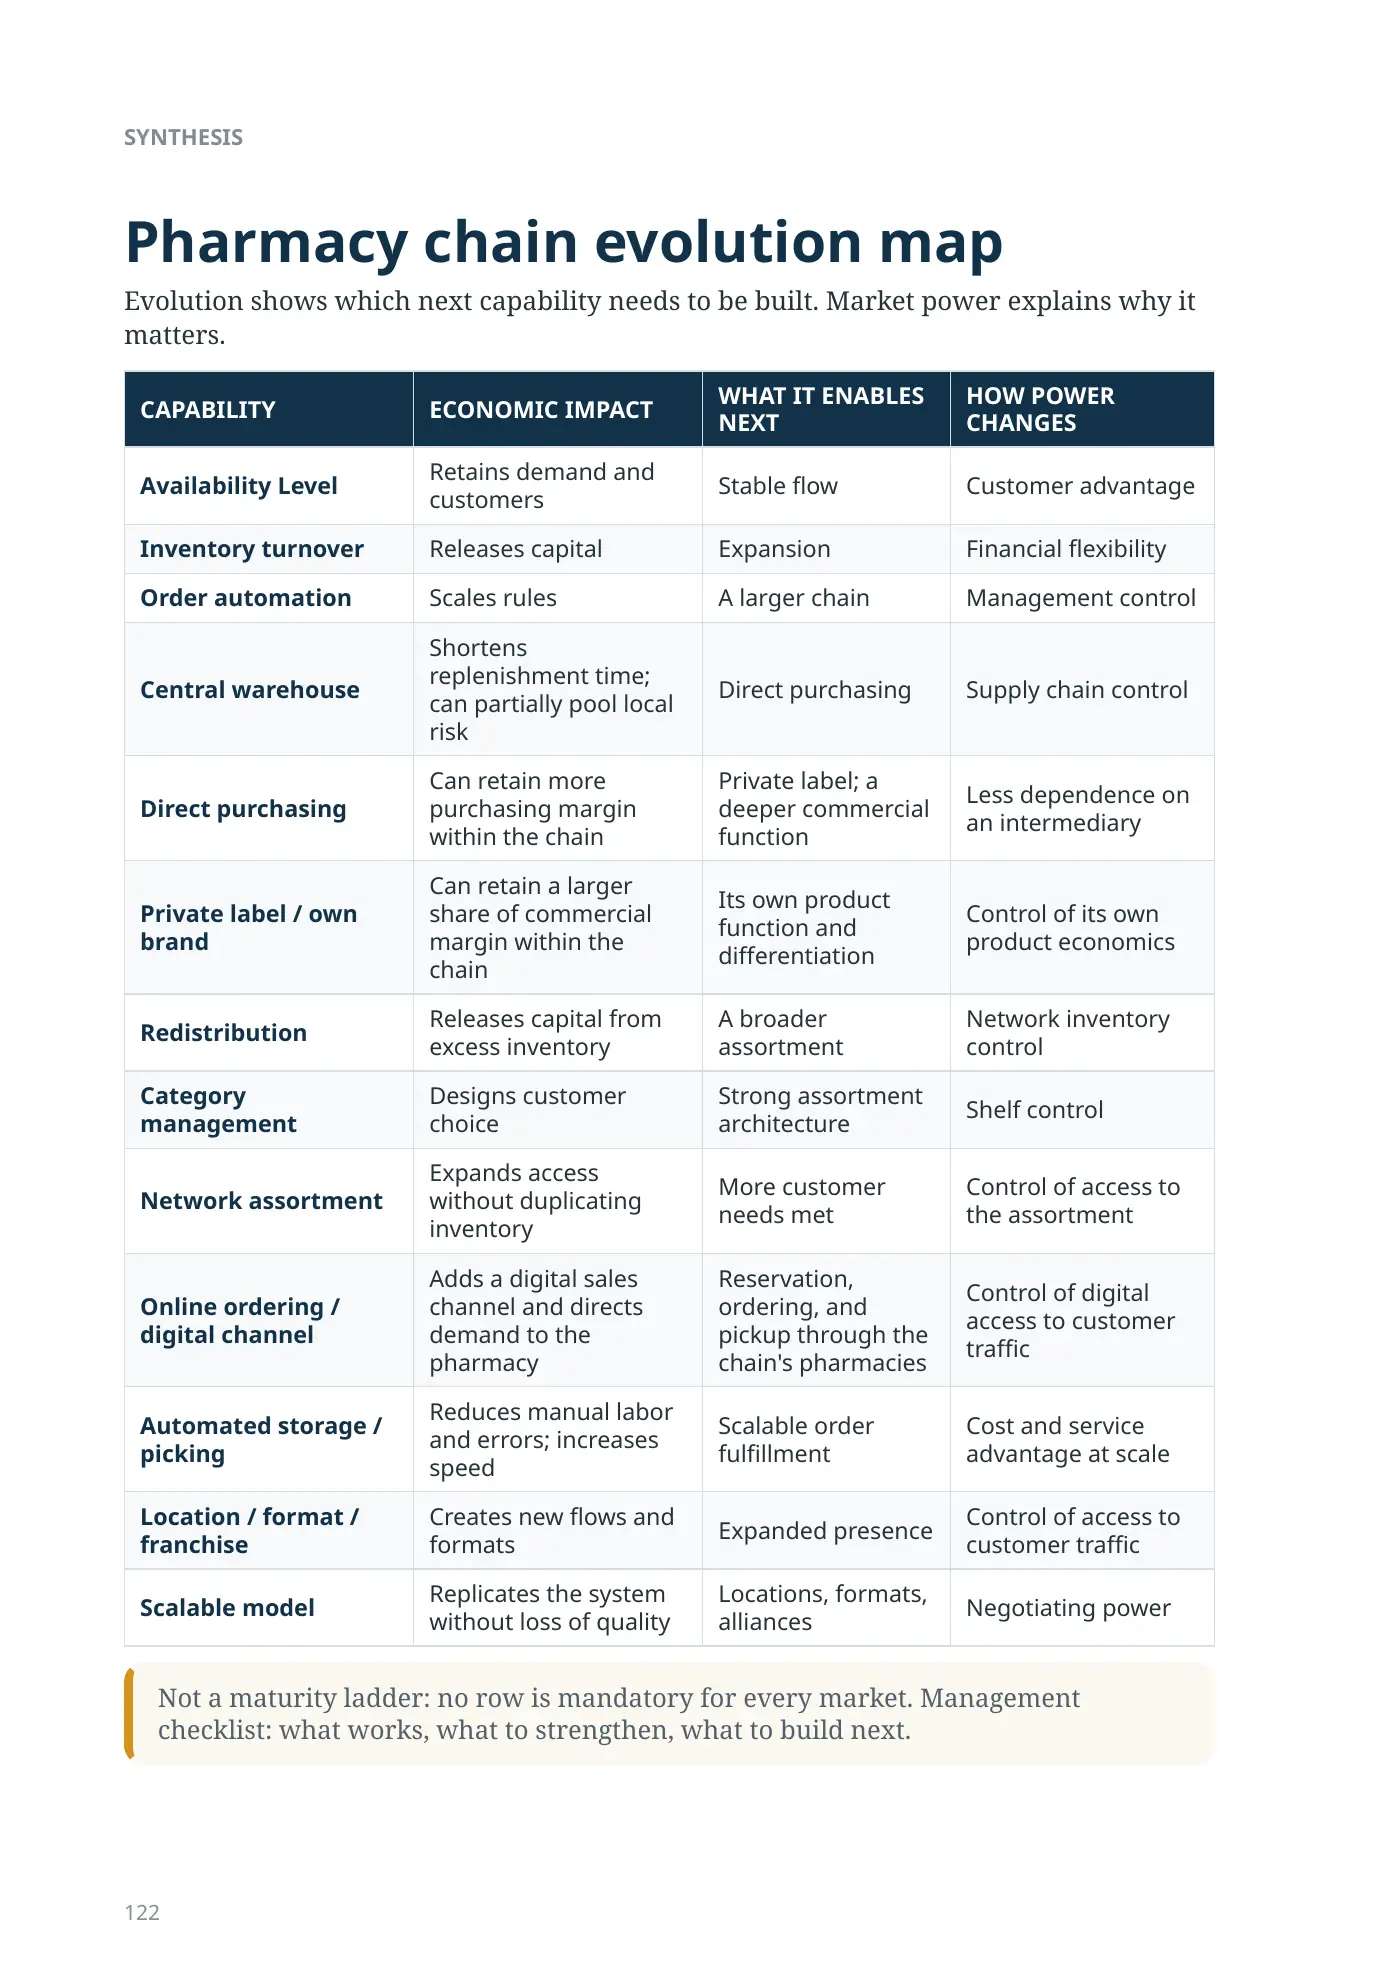
Pharmacy chain evolution map
Evolution shows which next capability needs to be built. Market power explains why it matters.
| CAPABILITY | ECONOMIC IMPACT | WHAT IT ENABLES NEXT | HOW POWER CHANGES |
|---|---|---|---|
| Availability Level | Retains demand and customers | Stable flow | Customer advantage |
| Inventory turnover | Releases capital | Expansion | Financial flexibility |
| Order automation | Scales rules | A larger chain | Management control |
| Central warehouse | Shortens replenishment time; can partially pool local risk | Direct purchasing | Supply chain control |
| Direct purchasing | Can retain more purchasing margin within the chain | Private label; a deeper commercial function | Less dependence on an intermediary |
| Private label / own brand | Can retain a larger share of commercial margin within the chain | Its own product function and differentiation | Control of its own product economics |
| Redistribution | Releases capital from excess inventory | A broader assortment | Network inventory control |
| Category management | Designs customer choice | Strong assortment architecture | Shelf control |
| Network assortment | Expands access without duplicating inventory | More customer needs met | Control of access to the assortment |
| Online ordering / digital channel | Adds a digital sales channel and directs demand to the pharmacy | Reservation, ordering, and pickup through the chain's pharmacies | Control of digital access to customer traffic |
| Automated storage / picking | Reduces manual labor and errors; increases speed | Scalable order fulfillment | Cost and service advantage at scale |
| Location / format / franchise | Creates new flows and formats | Expanded presence | Control of access to customer traffic |
| Scalable model | Replicates the system without loss of quality | Locations, formats, alliances | Negotiating power |
Not a maturity ladder: no row is mandatory for every market. Management checklist: what works, what to strengthen, what to build next.
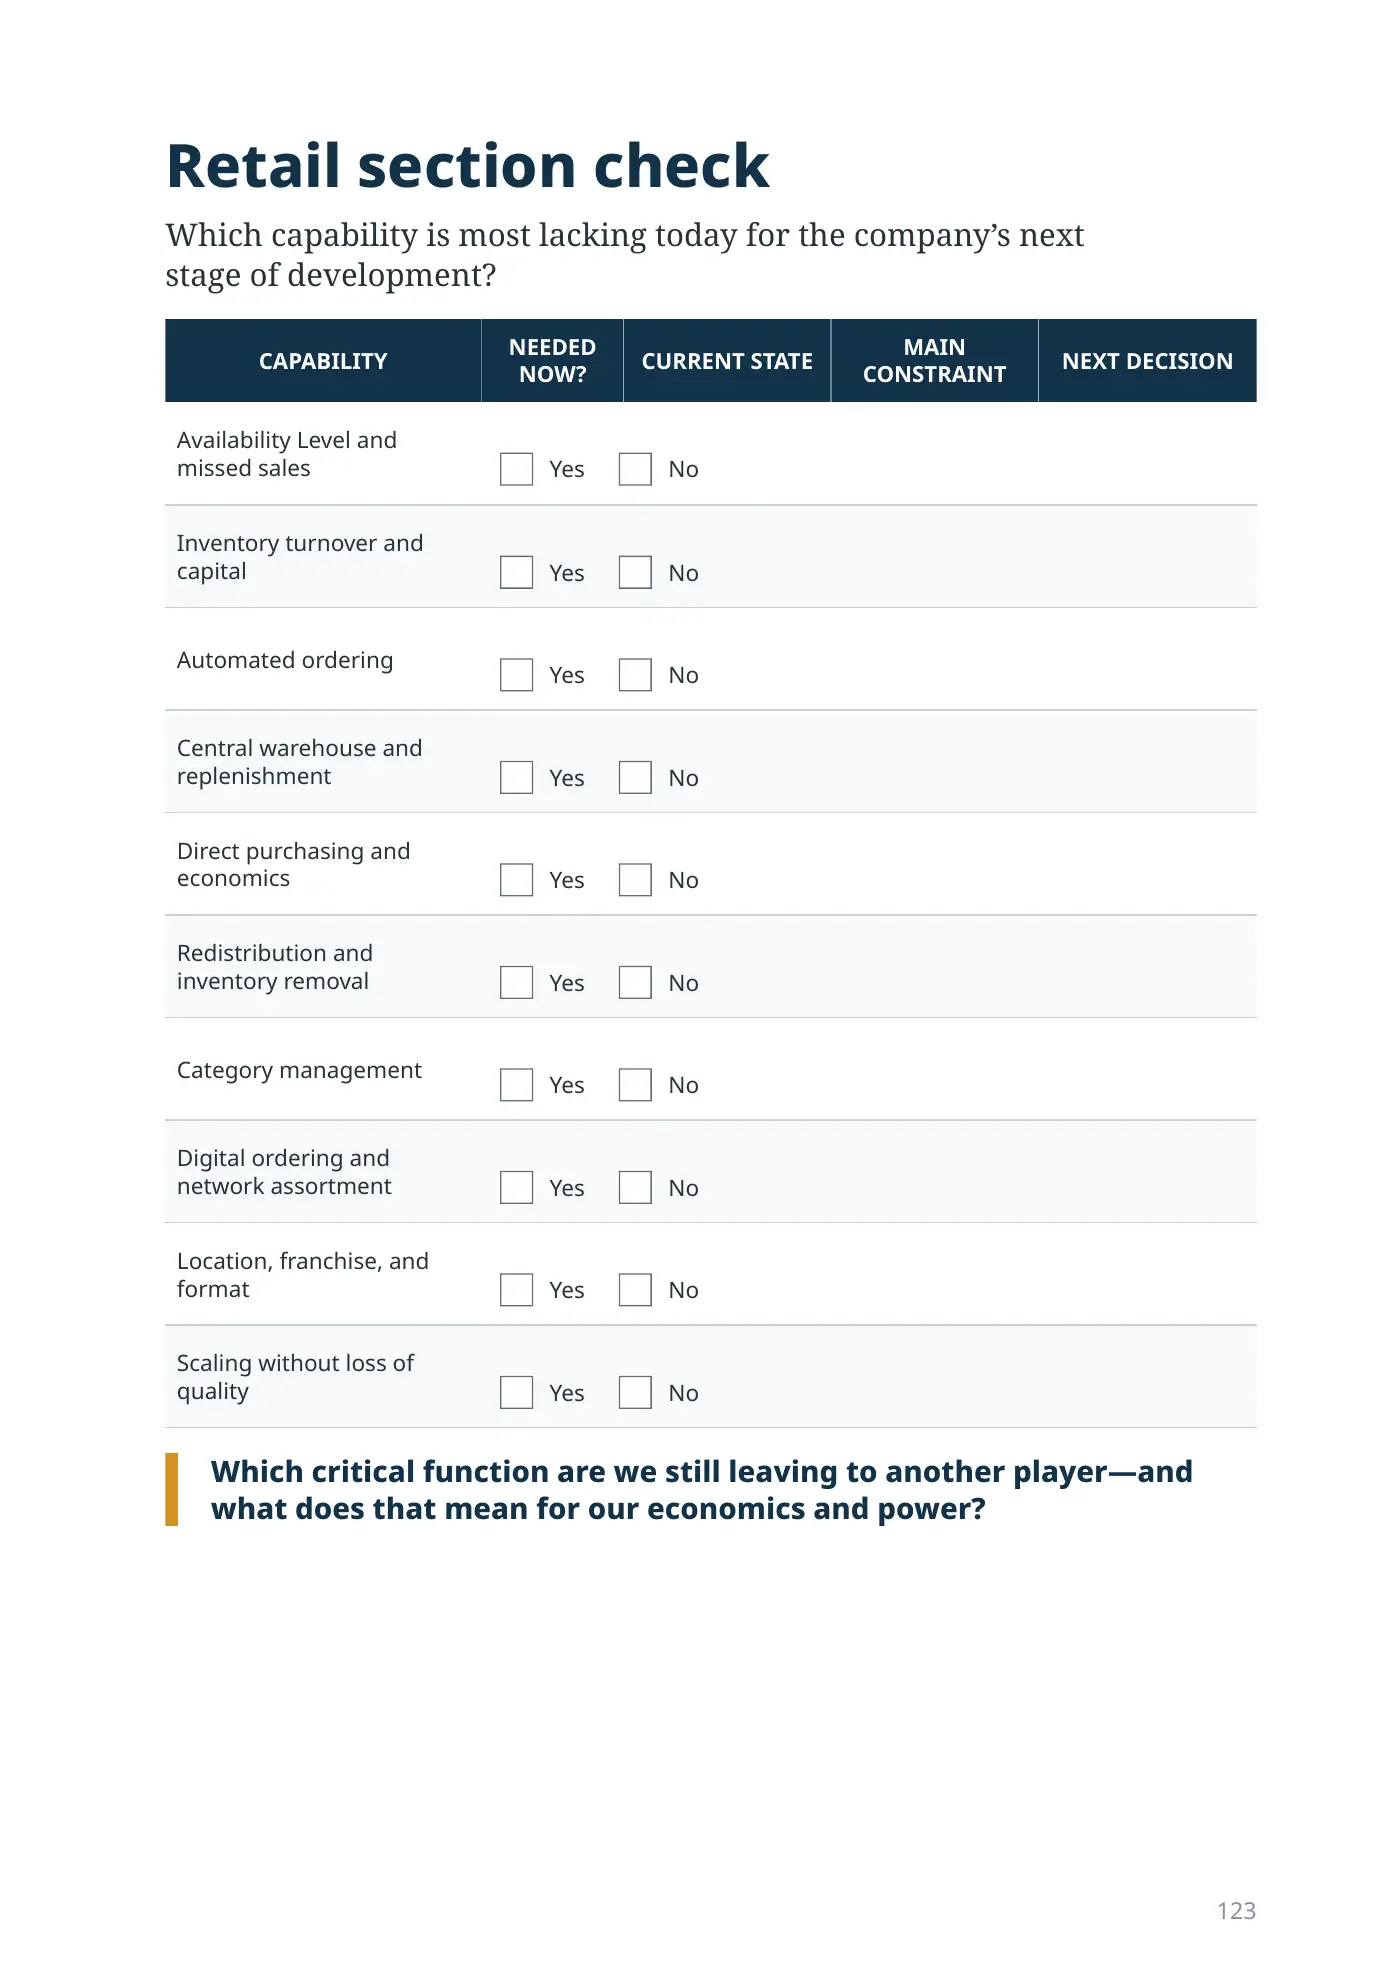
SYNTHESISRetail section check
Which capability is most lacking today for the company’s next stage of development?
| CAPABILITY | NEEDED NOW? | CURRENT STATE | MAIN CONSTRAINT | NEXT DECISION |
|---|---|---|---|---|
Availability Level and missed sales |
YesNo |
|||
Inventory turnover and capital |
YesNo |
|||
Automated ordering |
YesNo |
|||
Central warehouse and replenishment |
YesNo |
|||
Direct purchasing and economics |
YesNo |
|||
Redistribution and inventory removal |
YesNo |
|||
Category management |
YesNo |
|||
Digital ordering and network assortment |
YesNo |
|||
Location, franchise, and format |
YesNo |
|||
Scaling without loss of quality |
YesNo |
Which critical function are we still leaving to another player—and what does that mean for our economics and power?
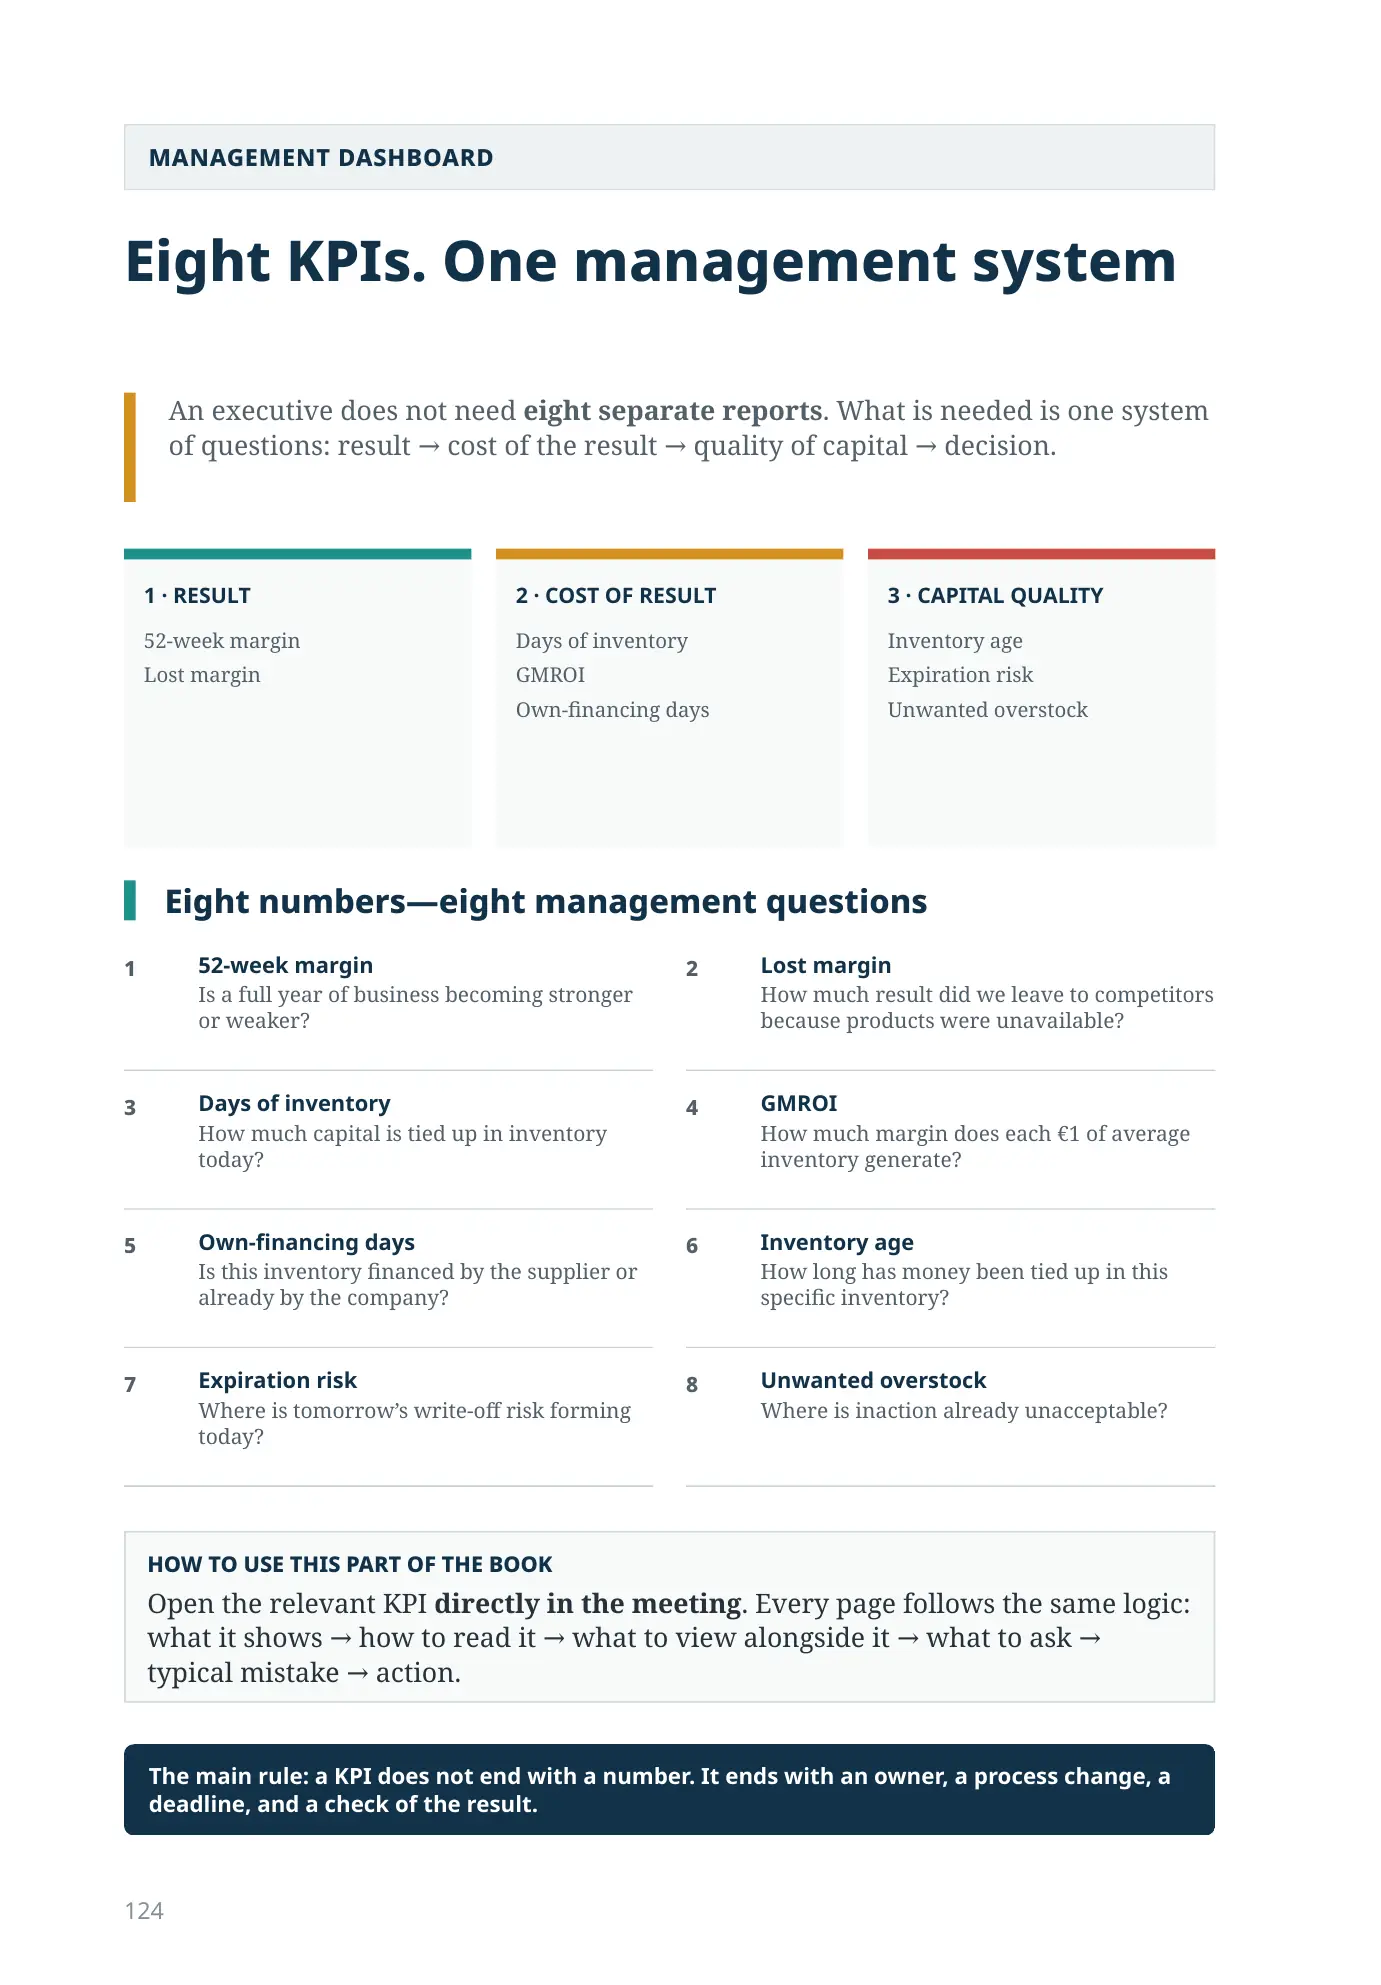
Eight KPIs. One management system
An executive does not need eight separate reports. What is needed is one system of questions: result → cost of the result → quality of capital → decision.
Lost margin
GMROI
Own-financing days
Expiration risk
Unwanted overstock
Eight numbers—eight management questions
Open the relevant KPI directly in the meeting. Every page follows the same logic: what it shows → how to read it → what to view alongside it → what to ask → typical mistake → action.
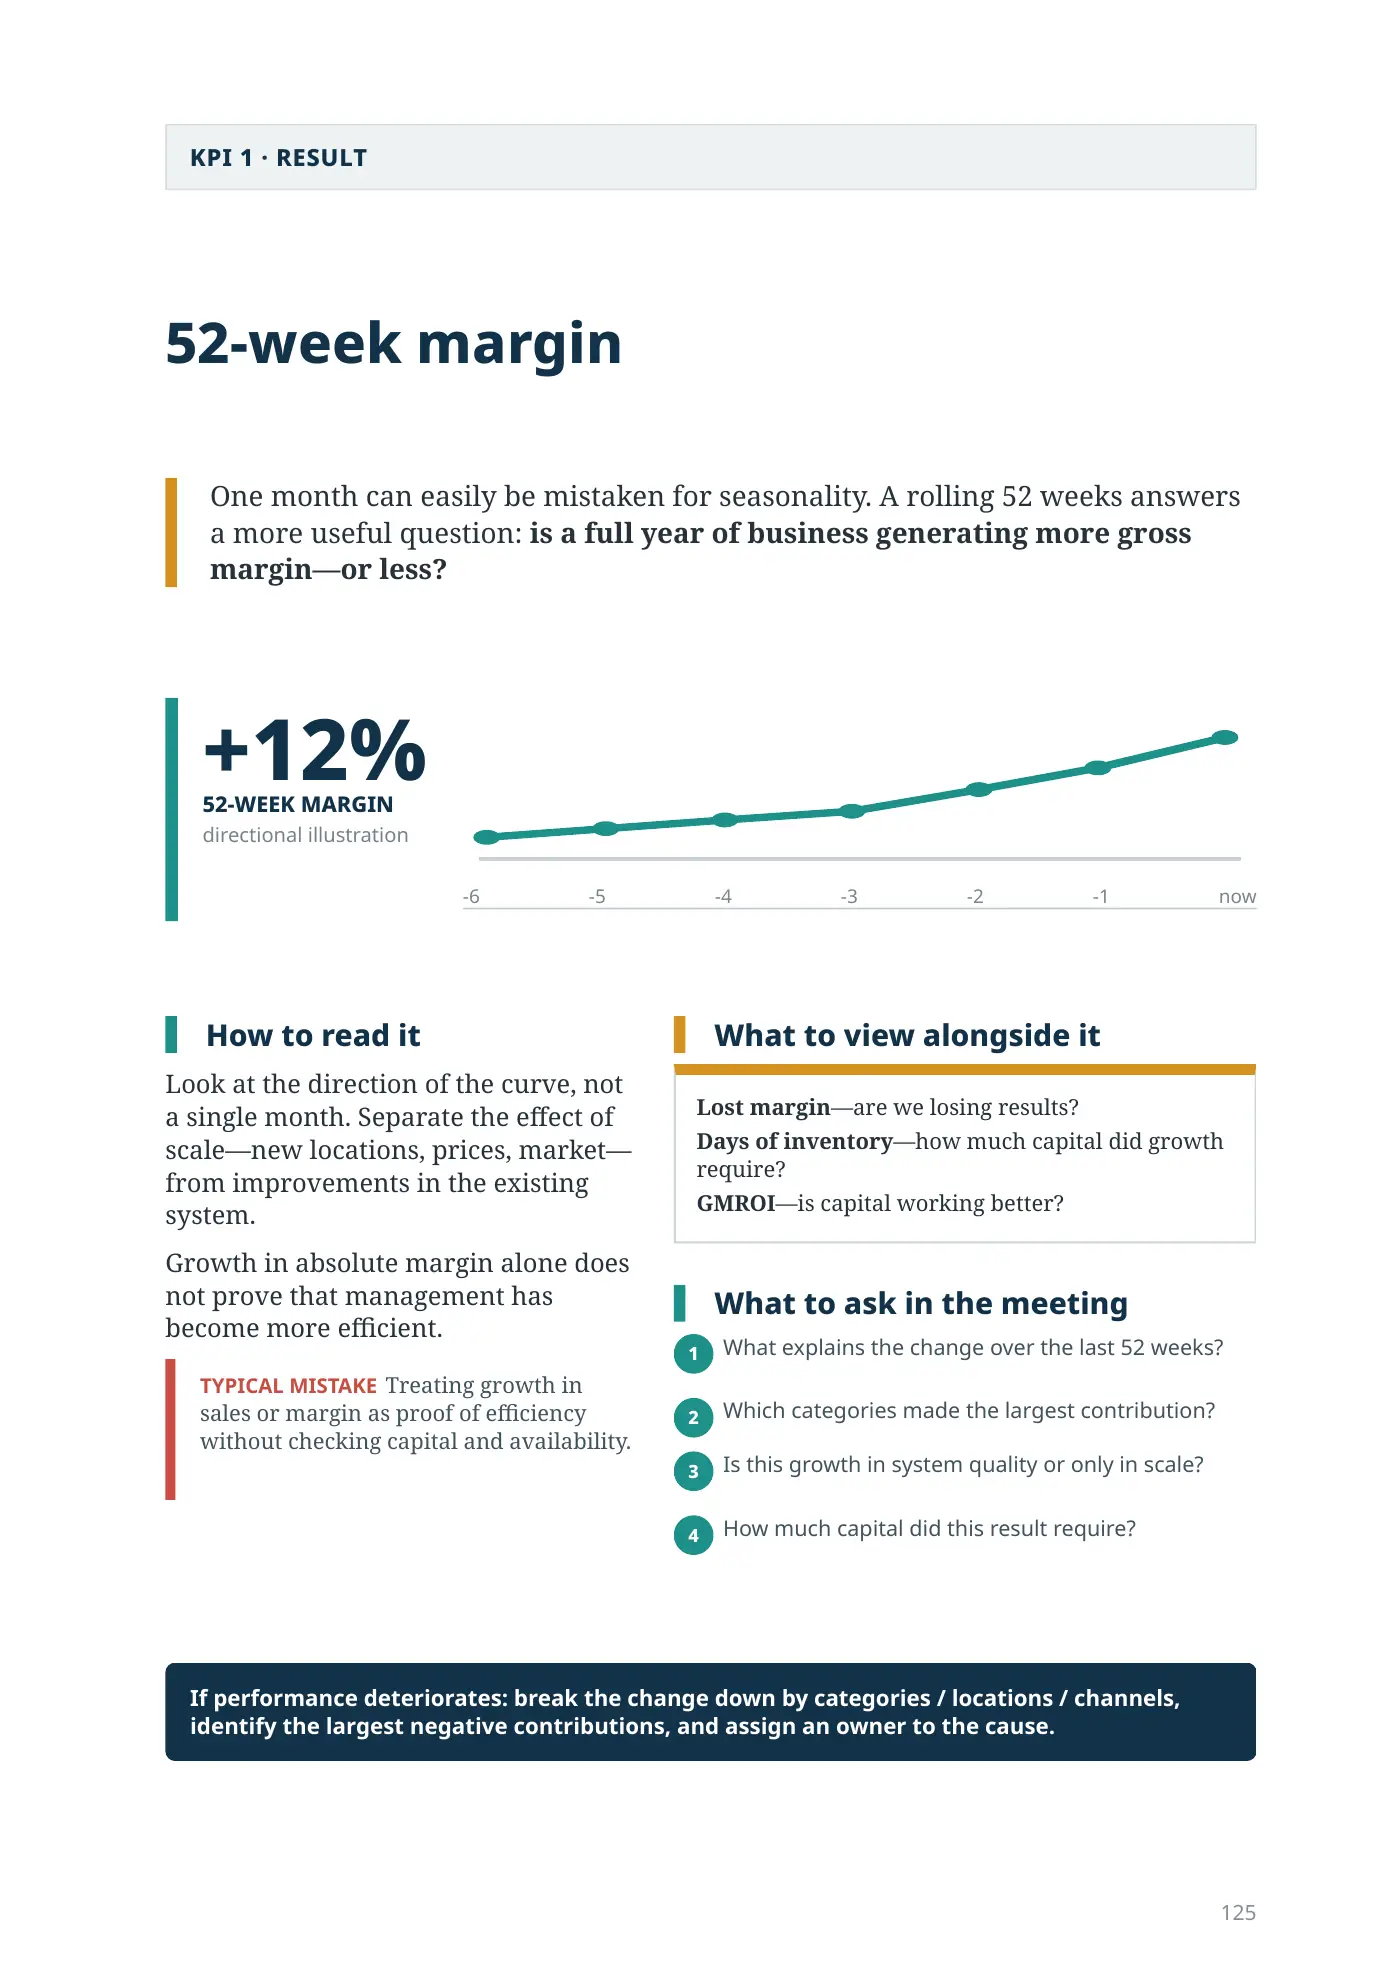
52-week margin
One month can easily be mistaken for seasonality. A rolling 52 weeks answers a more useful question: is a full year of business generating more gross margin—or less?
+12%
52-week margin
directional illustration
How to read it
Look at the direction of the curve, not a single month. Separate the effect of scale—new locations, prices, market—from improvements in the existing system.
Growth in absolute margin alone does not prove that management has become more efficient.
What to view alongside it
Lost margin—are we losing results?
Days of inventory—how much capital did growth require?
GMROI—is capital working better?
What to ask in the meeting
- What explains the change over the last 52 weeks?
- Which categories made the largest contribution?
- Is this growth in system quality or only in scale?
- How much capital did this result require?
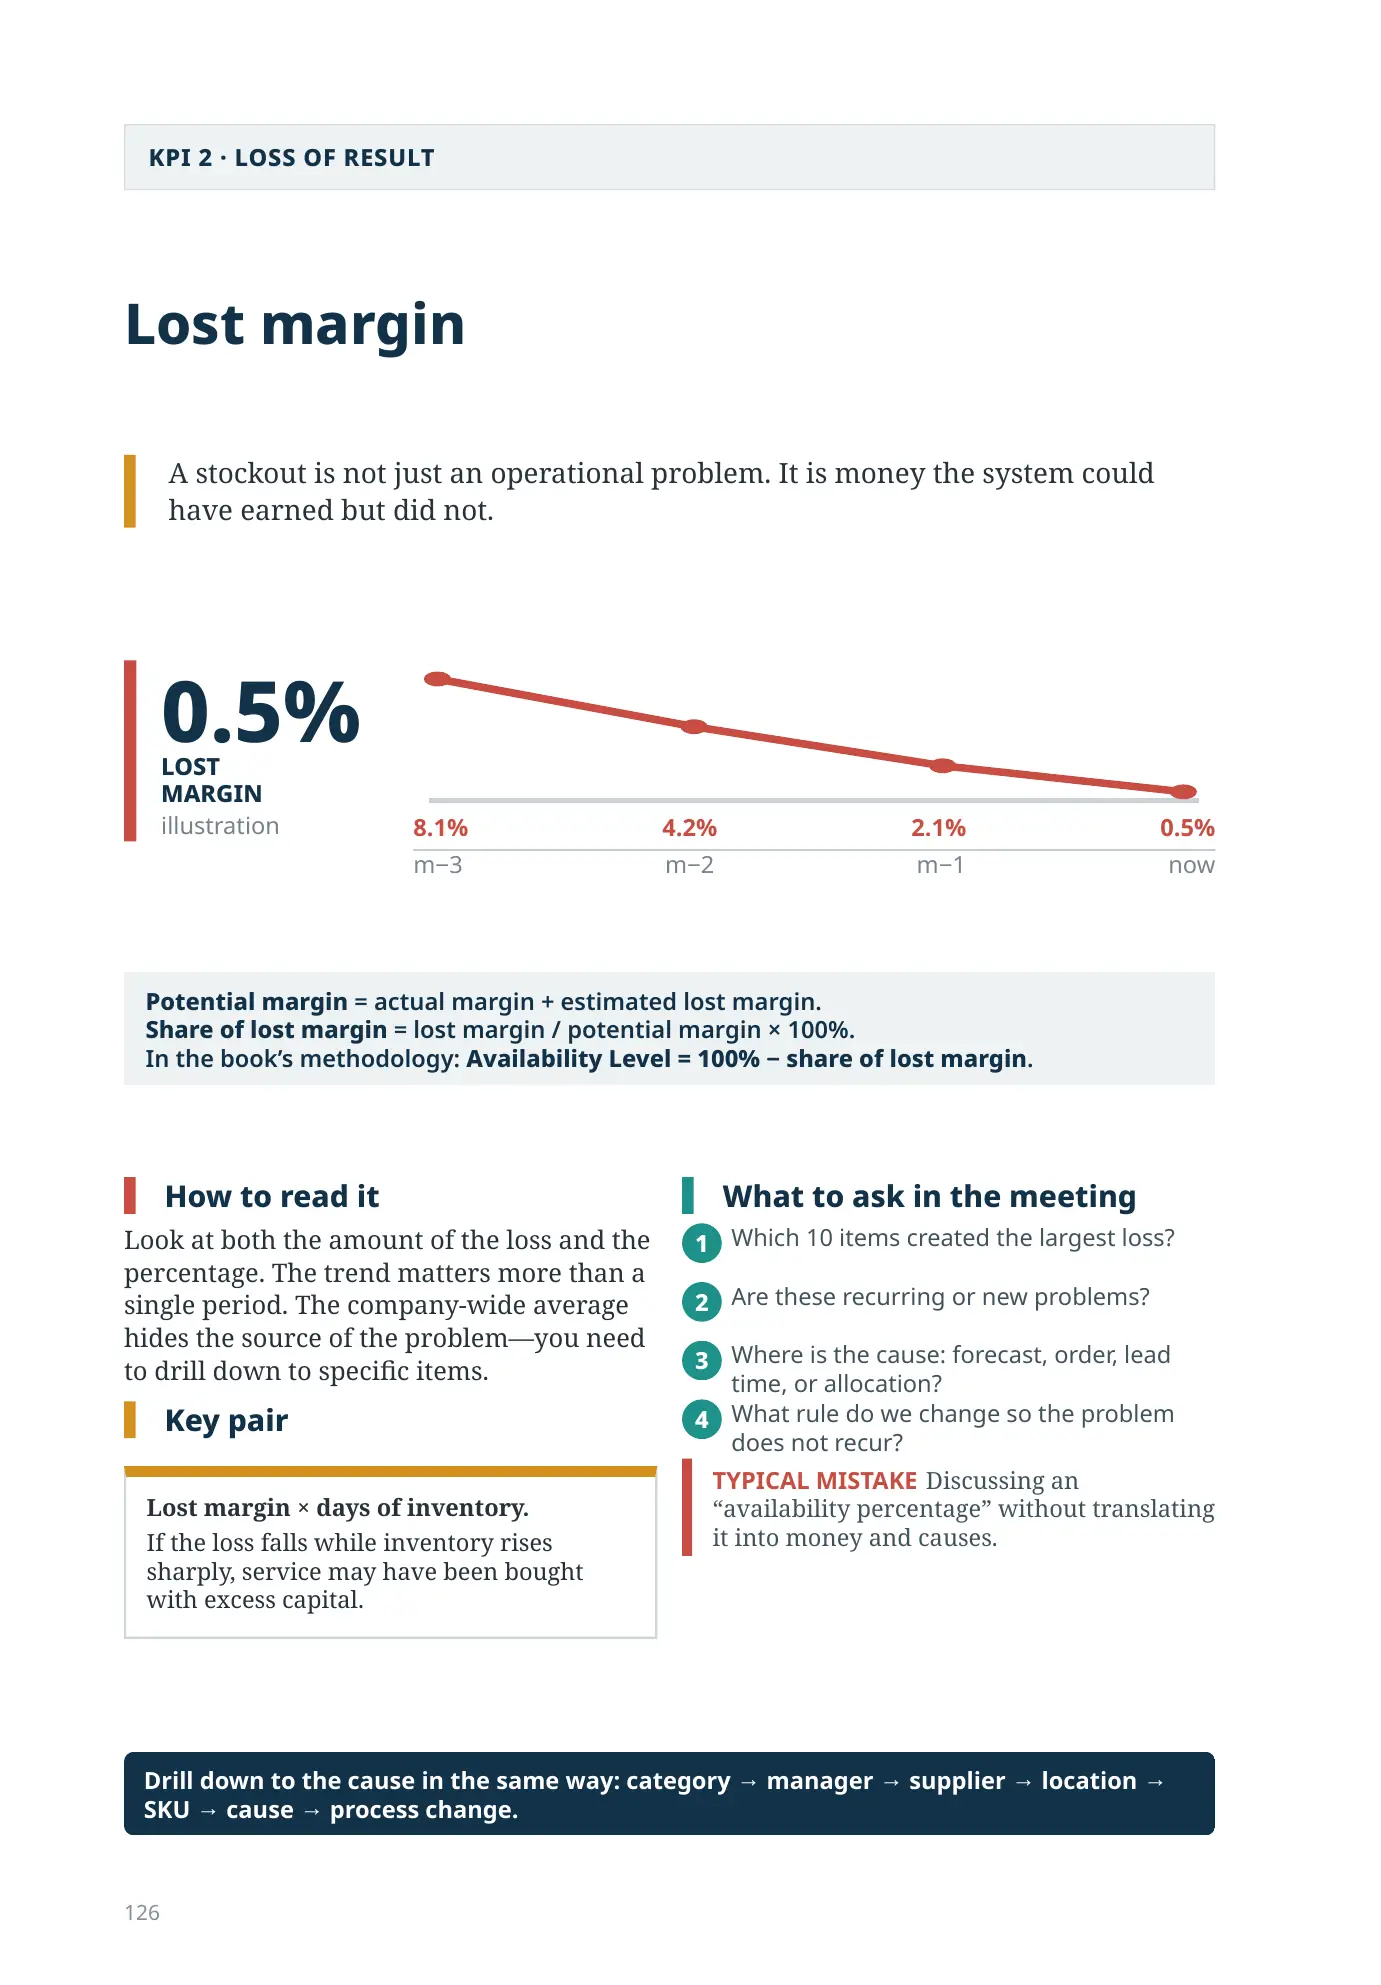
Lost margin
A stockout is not just an operational problem. It is money the system could have earned but did not.
0.5%
lost margin
illustration
Share of lost margin = lost margin / potential margin × 100%.
In the book’s methodology: Availability Level = 100% − share of lost margin.
How to read it
Look at both the amount of the loss and the percentage. The trend matters more than a single period. The company-wide average hides the source of the problem—you need to drill down to specific items.
Key pair
Lost margin × days of inventory.
If the loss falls while inventory rises sharply, service may have been bought with excess capital.
What to ask in the meeting
- Which 10 items created the largest loss?
- Are these recurring or new problems?
- Where is the cause: forecast, order, lead time, or allocation?
- What rule do we change so the problem does not recur?
Days of inventory
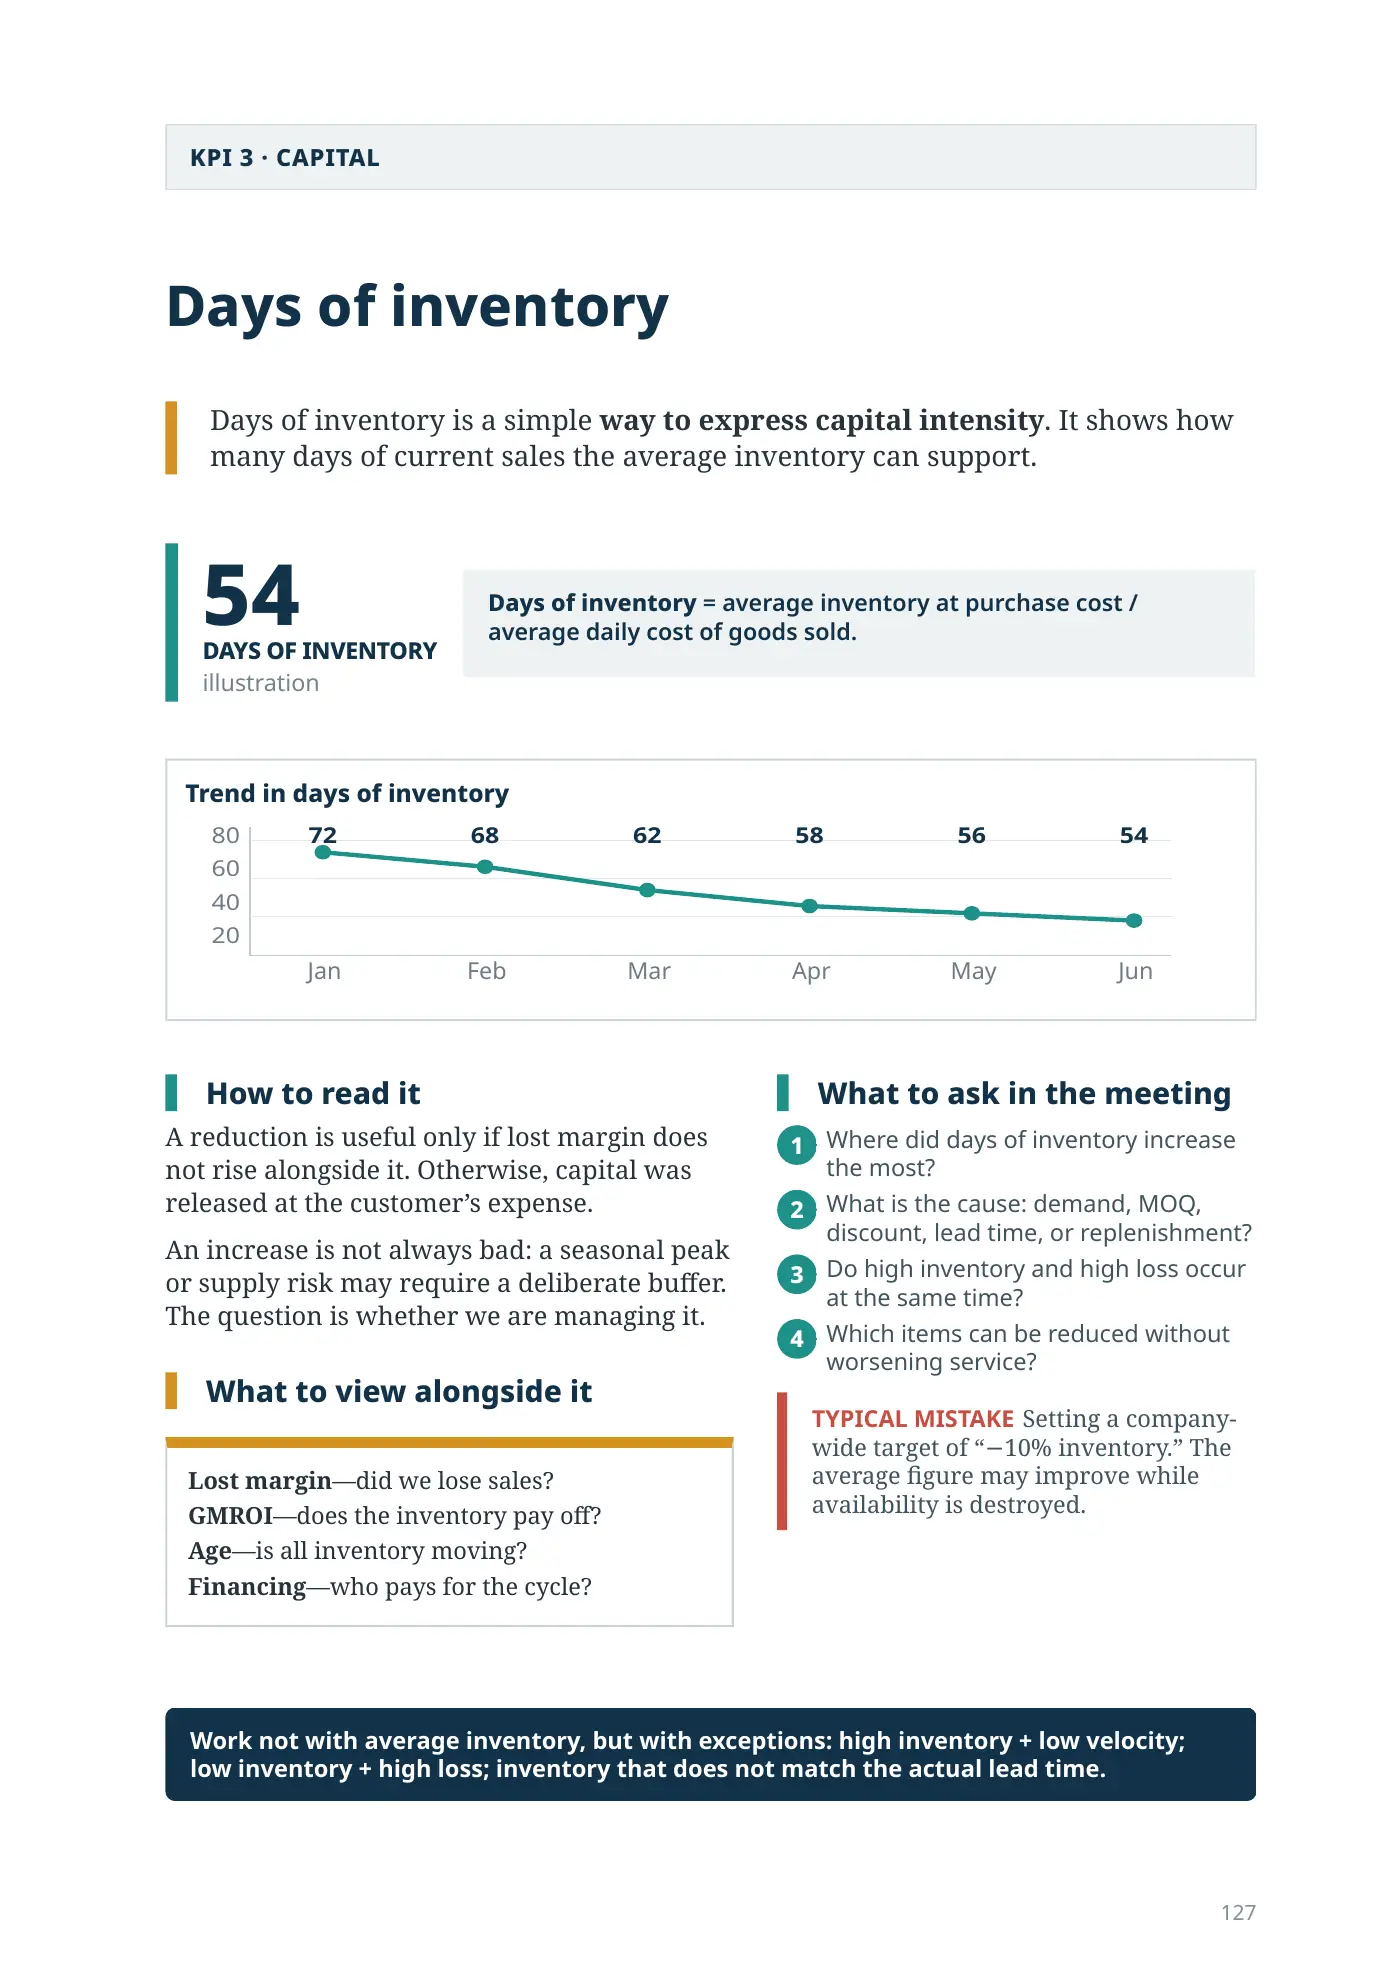
Days of inventory is a simple way to express capital intensity. It shows how many days of current sales the average inventory can support.
54
days of inventory
illustration
How to read it
A reduction is useful only if lost margin does not rise alongside it. Otherwise, capital was released at the customer’s expense.
An increase is not always bad: a seasonal peak or supply risk may require a deliberate buffer. The question is whether we are managing it.
What to view alongside it
Lost margin—did we lose sales?
GMROI—does the inventory pay off?
Age—is all inventory moving?
Financing—who pays for the cycle?
What to ask in the meeting
- Where did days of inventory increase the most?
- What is the cause: demand, MOQ, discount, lead time, or replenishment?
- Do high inventory and high loss occur at the same time?
- Which items can be reduced without worsening service?
GMROI — margin on inventory invested
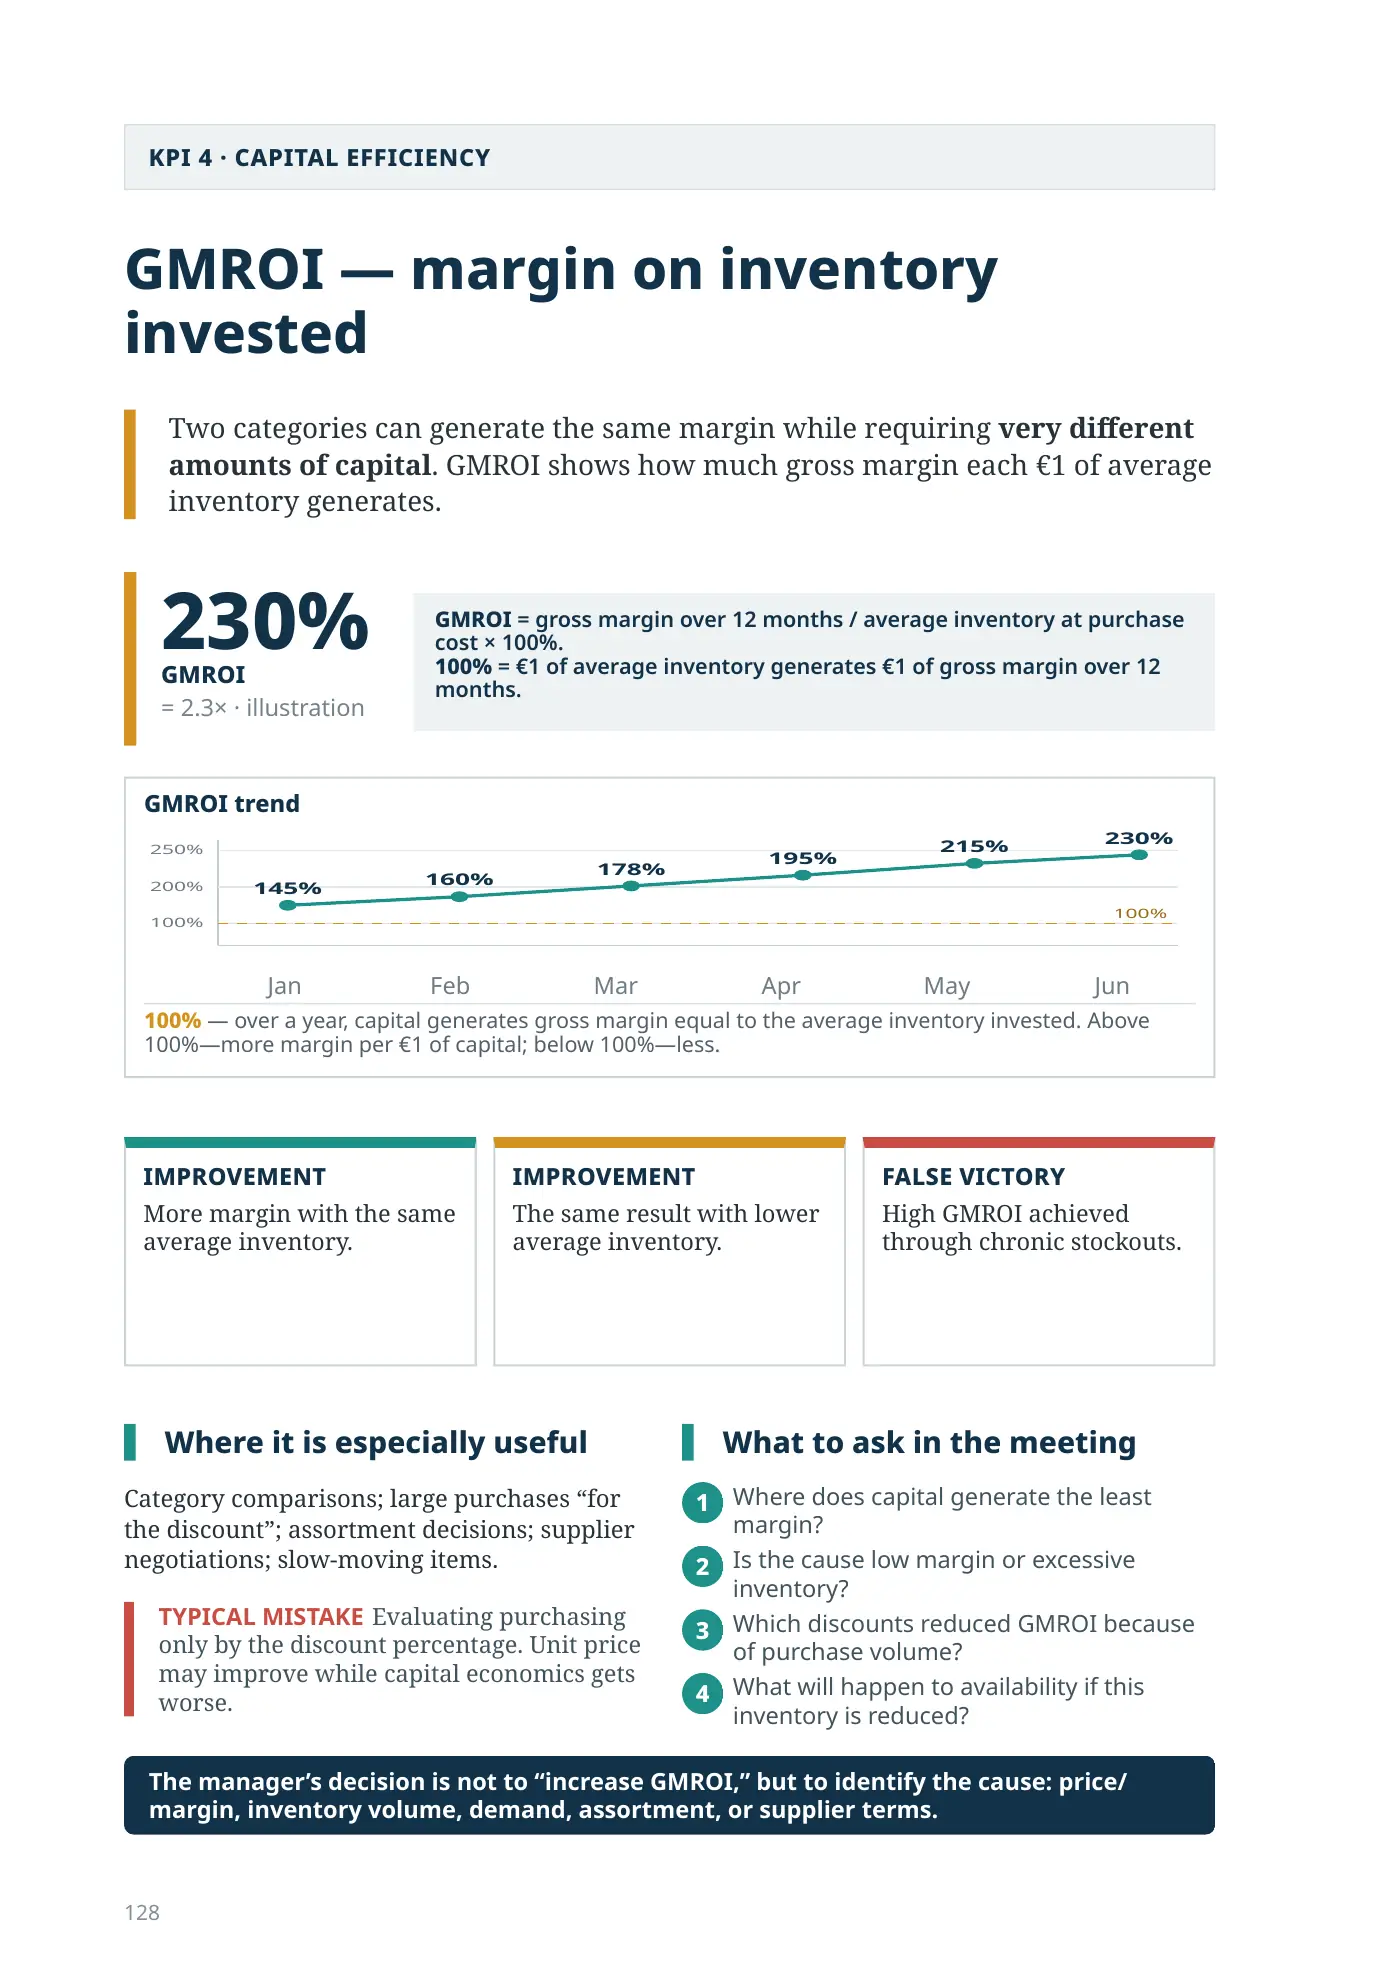
Two categories can generate the same margin while requiring very different amounts of capital. GMROI shows how much gross margin each €1 of average inventory generates.
230%
GMROI
= 2.3× · illustration
100% = €1 of average inventory generates €1 of gross margin over 12 months.
More margin with the same average inventory.
The same result with lower average inventory.
High GMROI achieved through chronic stockouts.
Where it is especially useful
Category comparisons; large purchases “for the discount”; assortment decisions; supplier negotiations; slow-moving items.
What to ask in the meeting
- Where does capital generate the least margin?
- Is the cause low margin or excessive inventory?
- Which discounts reduced GMROI because of purchase volume?
- What will happen to availability if this inventory is reduced?
Own-financing days
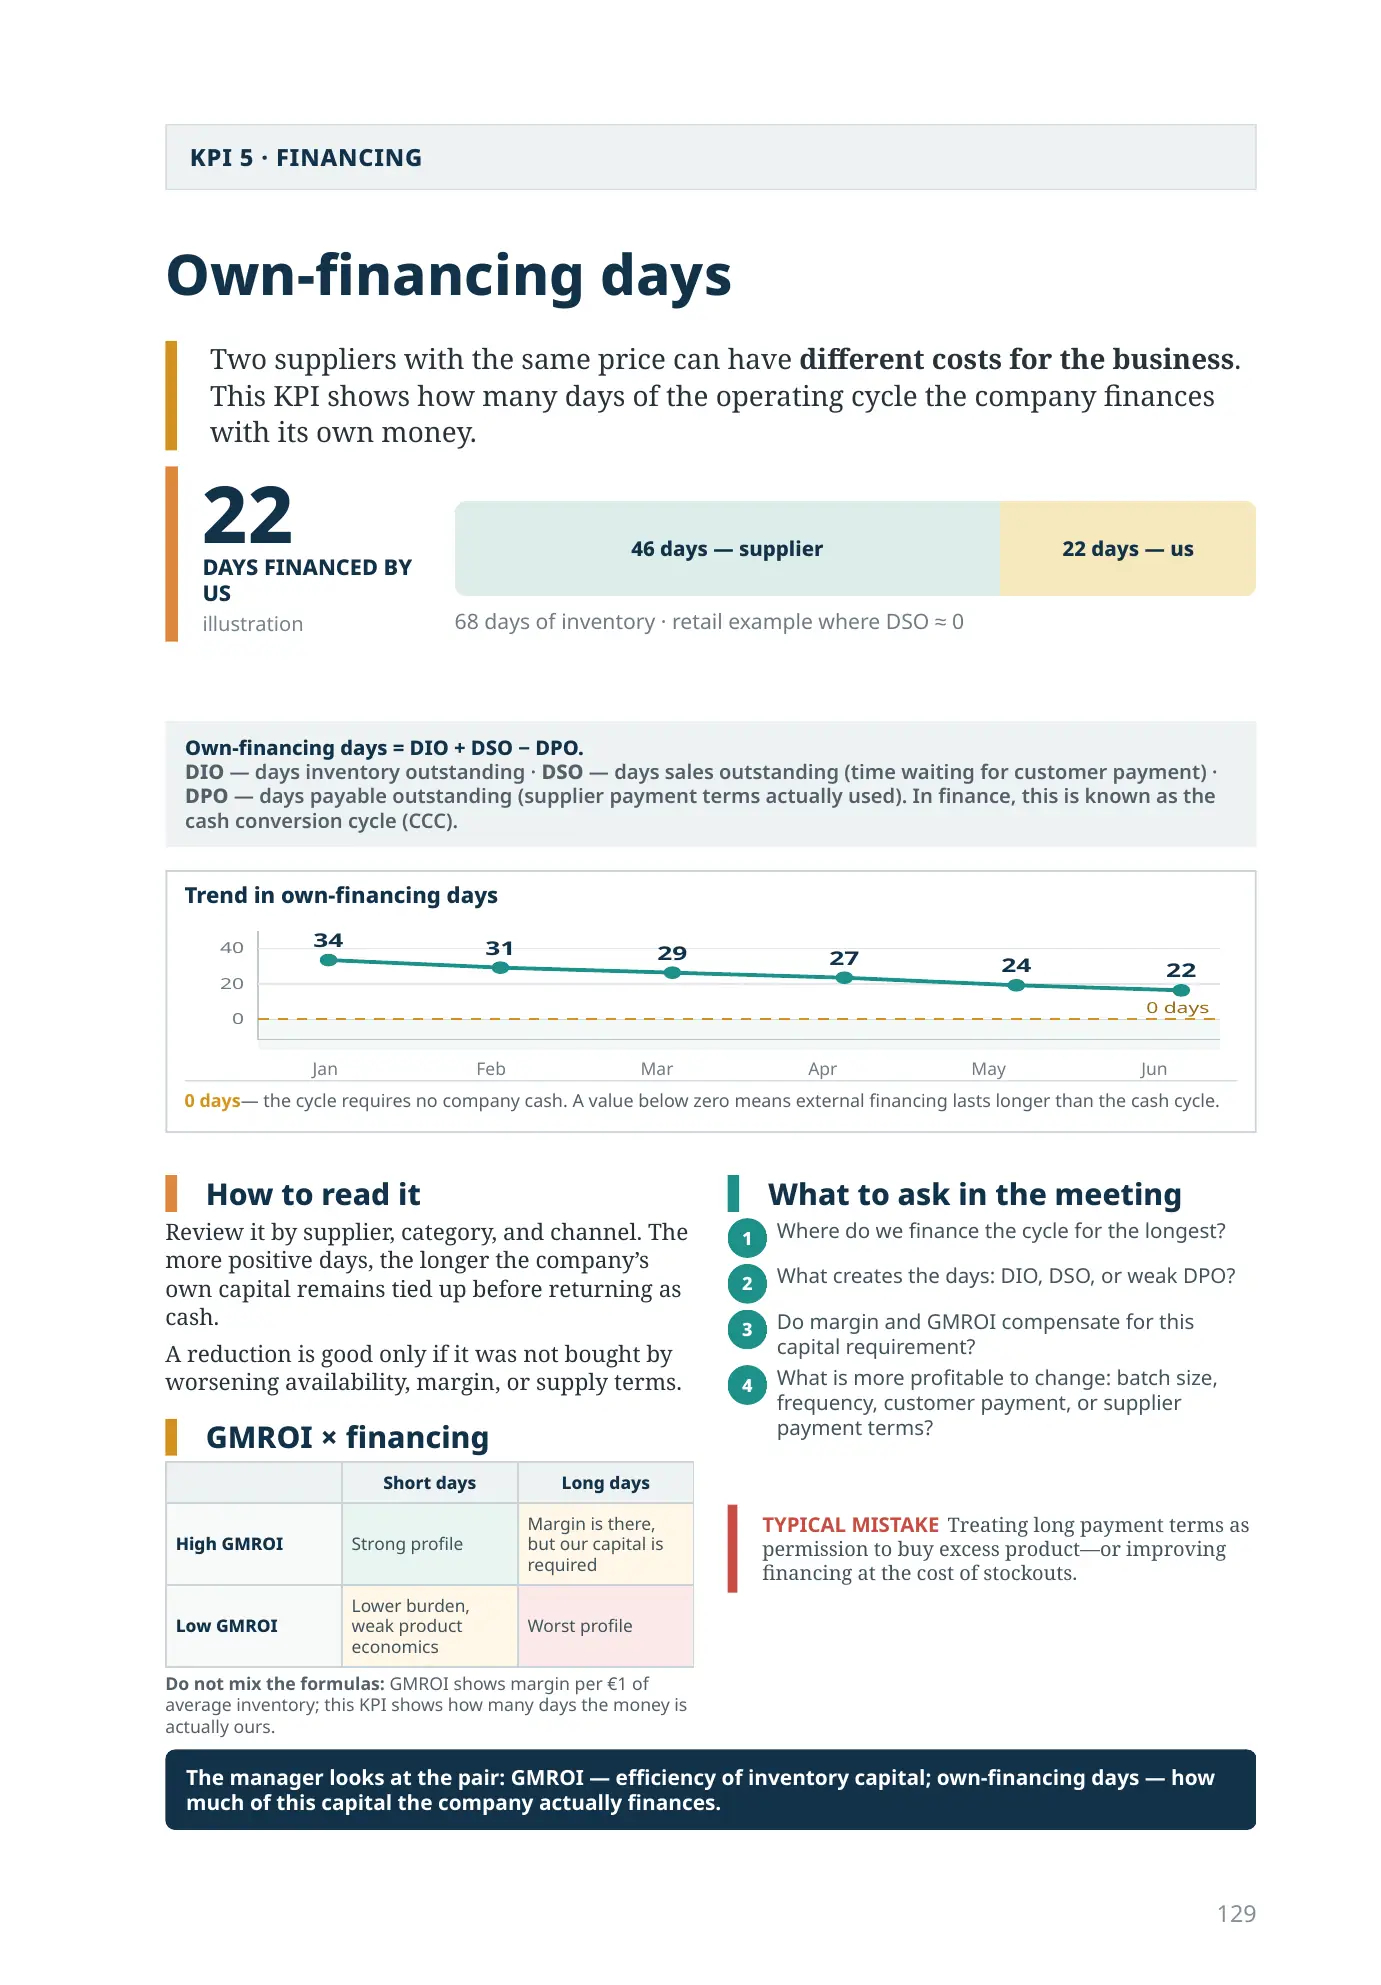
Two suppliers with the same price can have different costs for the business. This KPI shows how many days of the operating cycle the company finances with its own money.
22
days financed by us
illustration
68 days of inventory · retail example where DSO ≈ 0
DIO — days inventory outstanding · DSO — days sales outstanding (time waiting for customer payment) · DPO — days payable outstanding (supplier payment terms actually used). In finance, this is known as the cash conversion cycle (CCC).
How to read it
Review it by supplier, category, and channel. The more positive days, the longer the company’s own capital remains tied up before returning as cash.
A reduction is good only if it was not bought by worsening availability, margin, or supply terms.
GMROI × financing
| Short days | Long days | |
|---|---|---|
| High GMROI | Strong profile | Margin is there, but our capital is required |
| Low GMROI | Lower burden, weak product economics | Worst profile |
Do not mix the formulas: GMROI shows margin per €1 of average inventory; this KPI shows how many days the money is actually ours.
What to ask in the meeting
- Where do we finance the cycle for the longest?
- What creates the days: DIO, DSO, or weak DPO?
- Do margin and GMROI compensate for this capital requirement?
- What is more profitable to change: batch size, frequency, customer payment, or supplier payment terms?
Inventory age
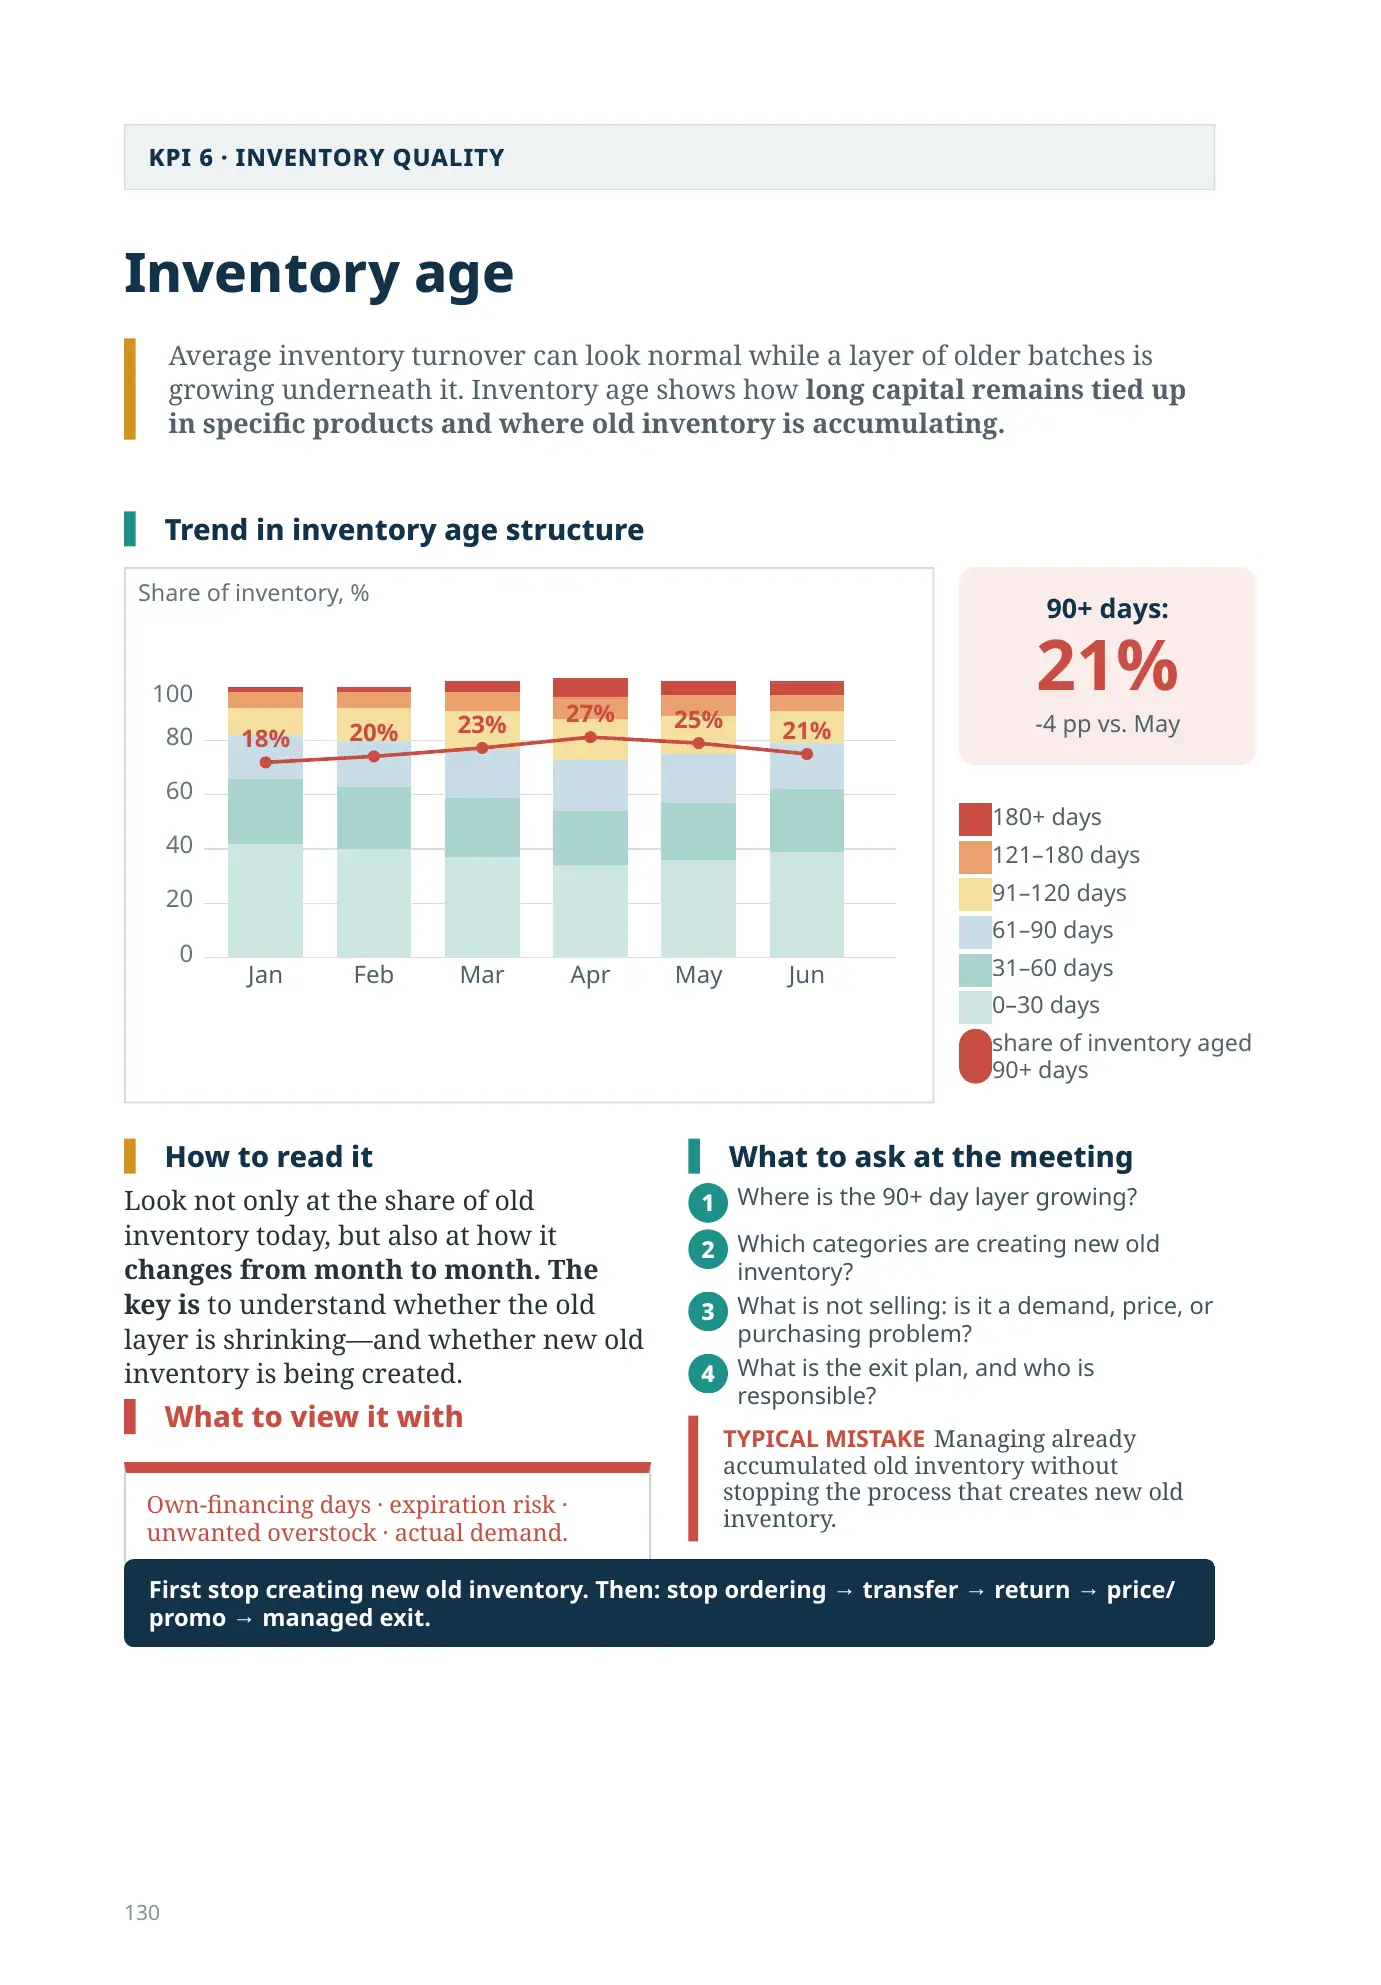
Average inventory turnover can look normal while a layer of older batches is growing underneath it. Inventory age shows how long capital remains tied up in specific products and where old inventory is accumulating.
Trend in inventory age structure
How to read it
Look not only at the share of old inventory today, but also at how it changes from month to month. The key is to understand whether the old layer is shrinking—and whether new old inventory is being created.
What to view it with
Own-financing days · expiration risk · unwanted overstock · actual demand.
What to ask at the meeting
- Where is the 90+ day layer growing?
- Which categories are creating new old inventory?
- What is not selling: is it a demand, price, or purchasing problem?
- What is the exit plan, and who is responsible?
Expiration risk
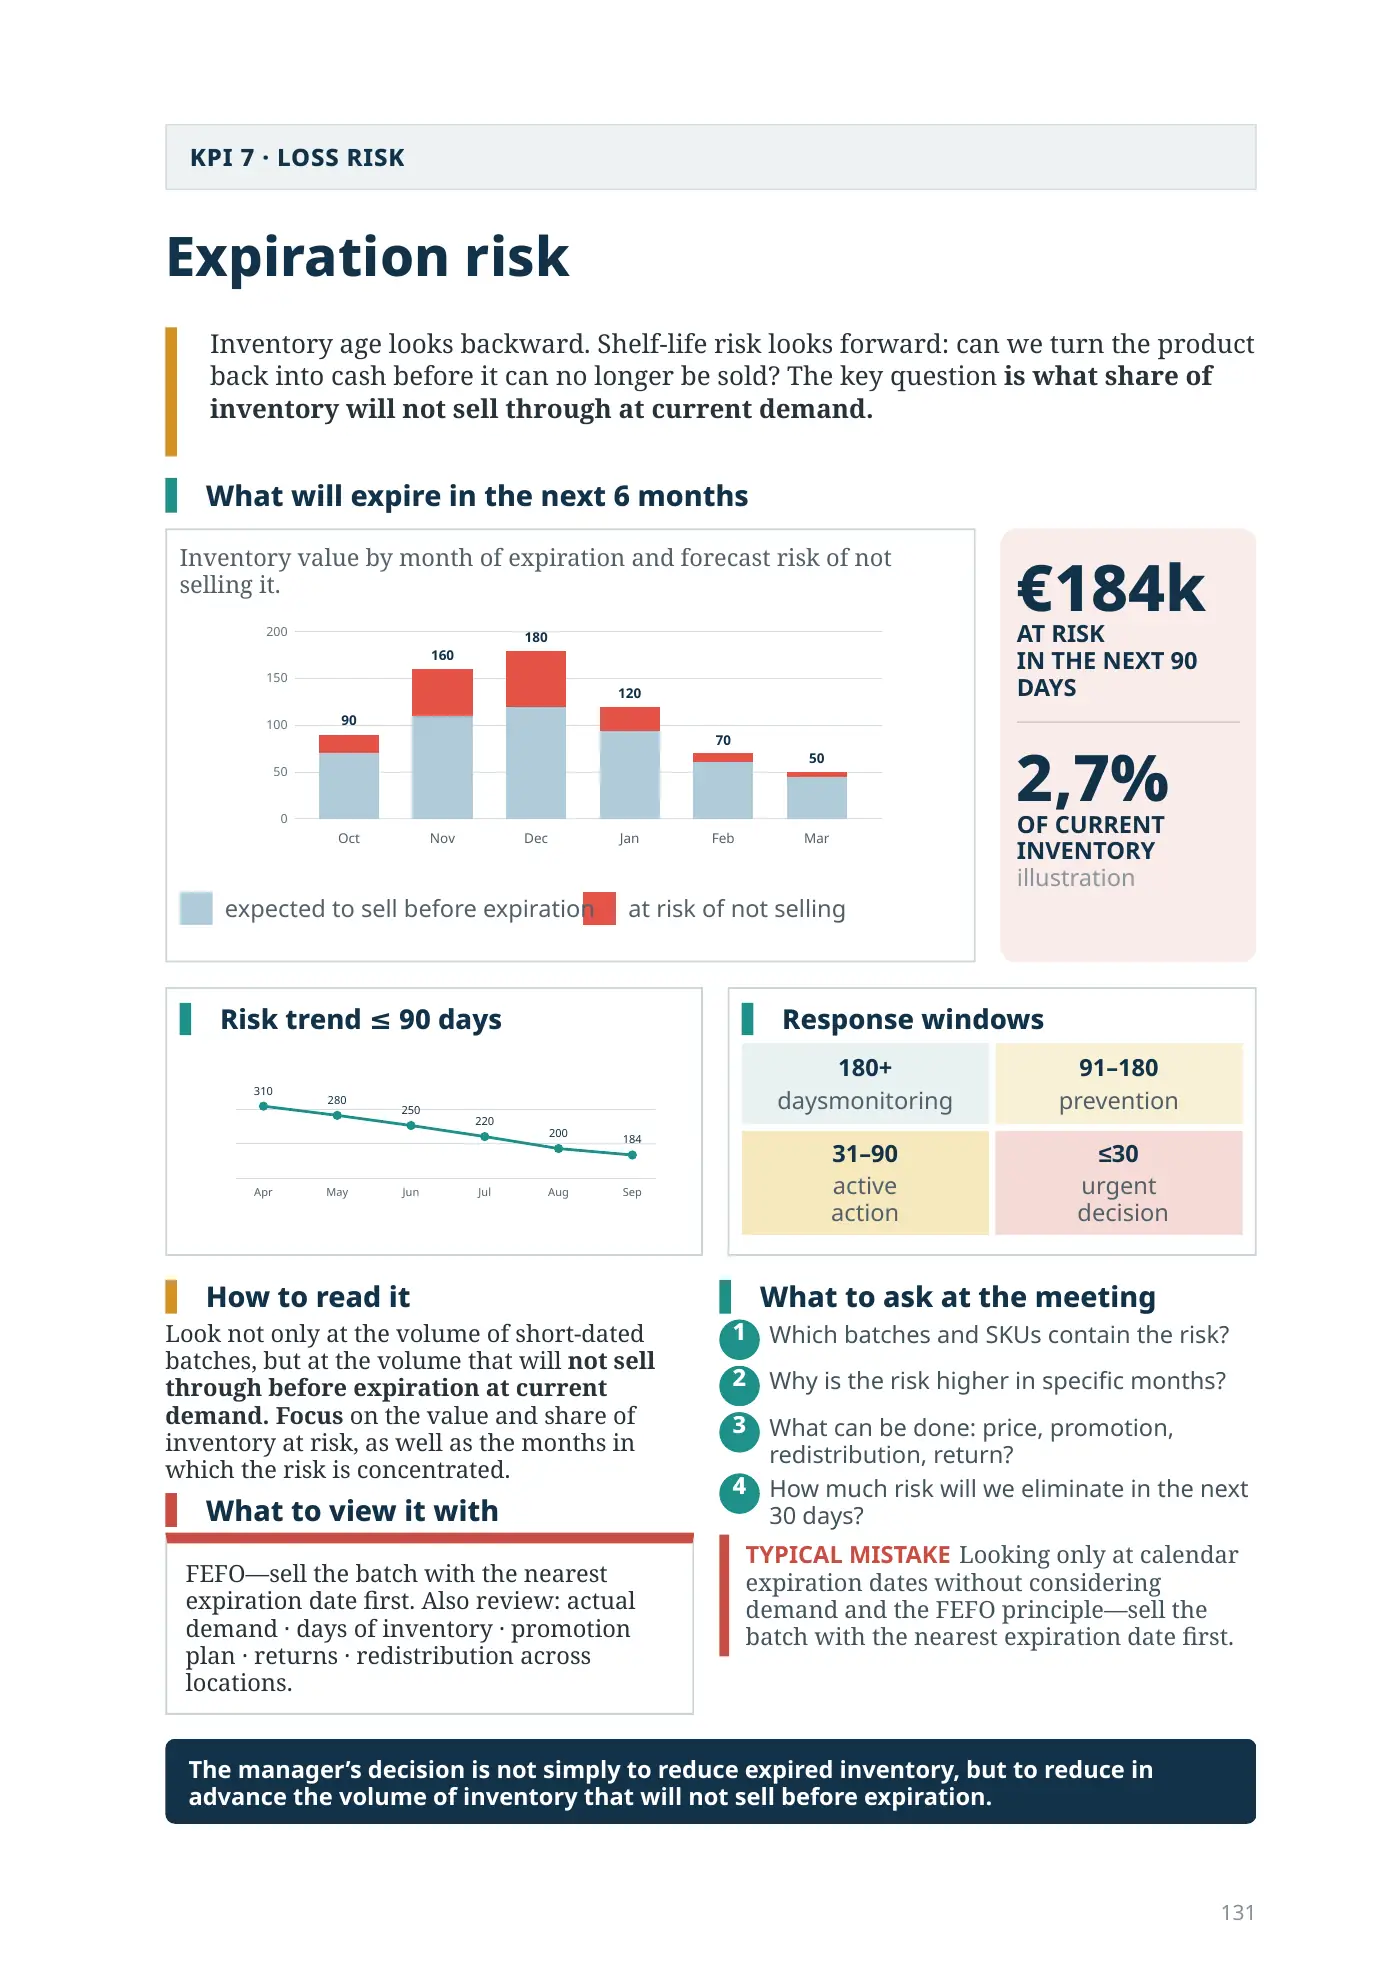
Inventory age looks backward. Shelf-life risk looks forward: can we turn the product back into cash before it can no longer be sold? The key question is what share of inventory will not sell through at current demand.
What will expire in the next 6 months
in the next 90 days
2,7%of current inventoryillustration
Risk trend ≤ 90 days
Response windows
How to read it
Look not only at the volume of short-dated batches, but at the volume that will not sell through before expiration at current demand. Focus on the value and share of inventory at risk, as well as the months in which the risk is concentrated.
What to view it with
FEFO—sell the batch with the nearest expiration date first. Also review: actual demand · days of inventory · promotion plan · returns · redistribution across locations.
What to ask at the meeting
- Which batches and SKUs contain the risk?
- Why is the risk higher in specific months?
- What can be done: price, promotion, redistribution, return?
- How much risk will we eliminate in the next 30 days?
Unwanted overstock
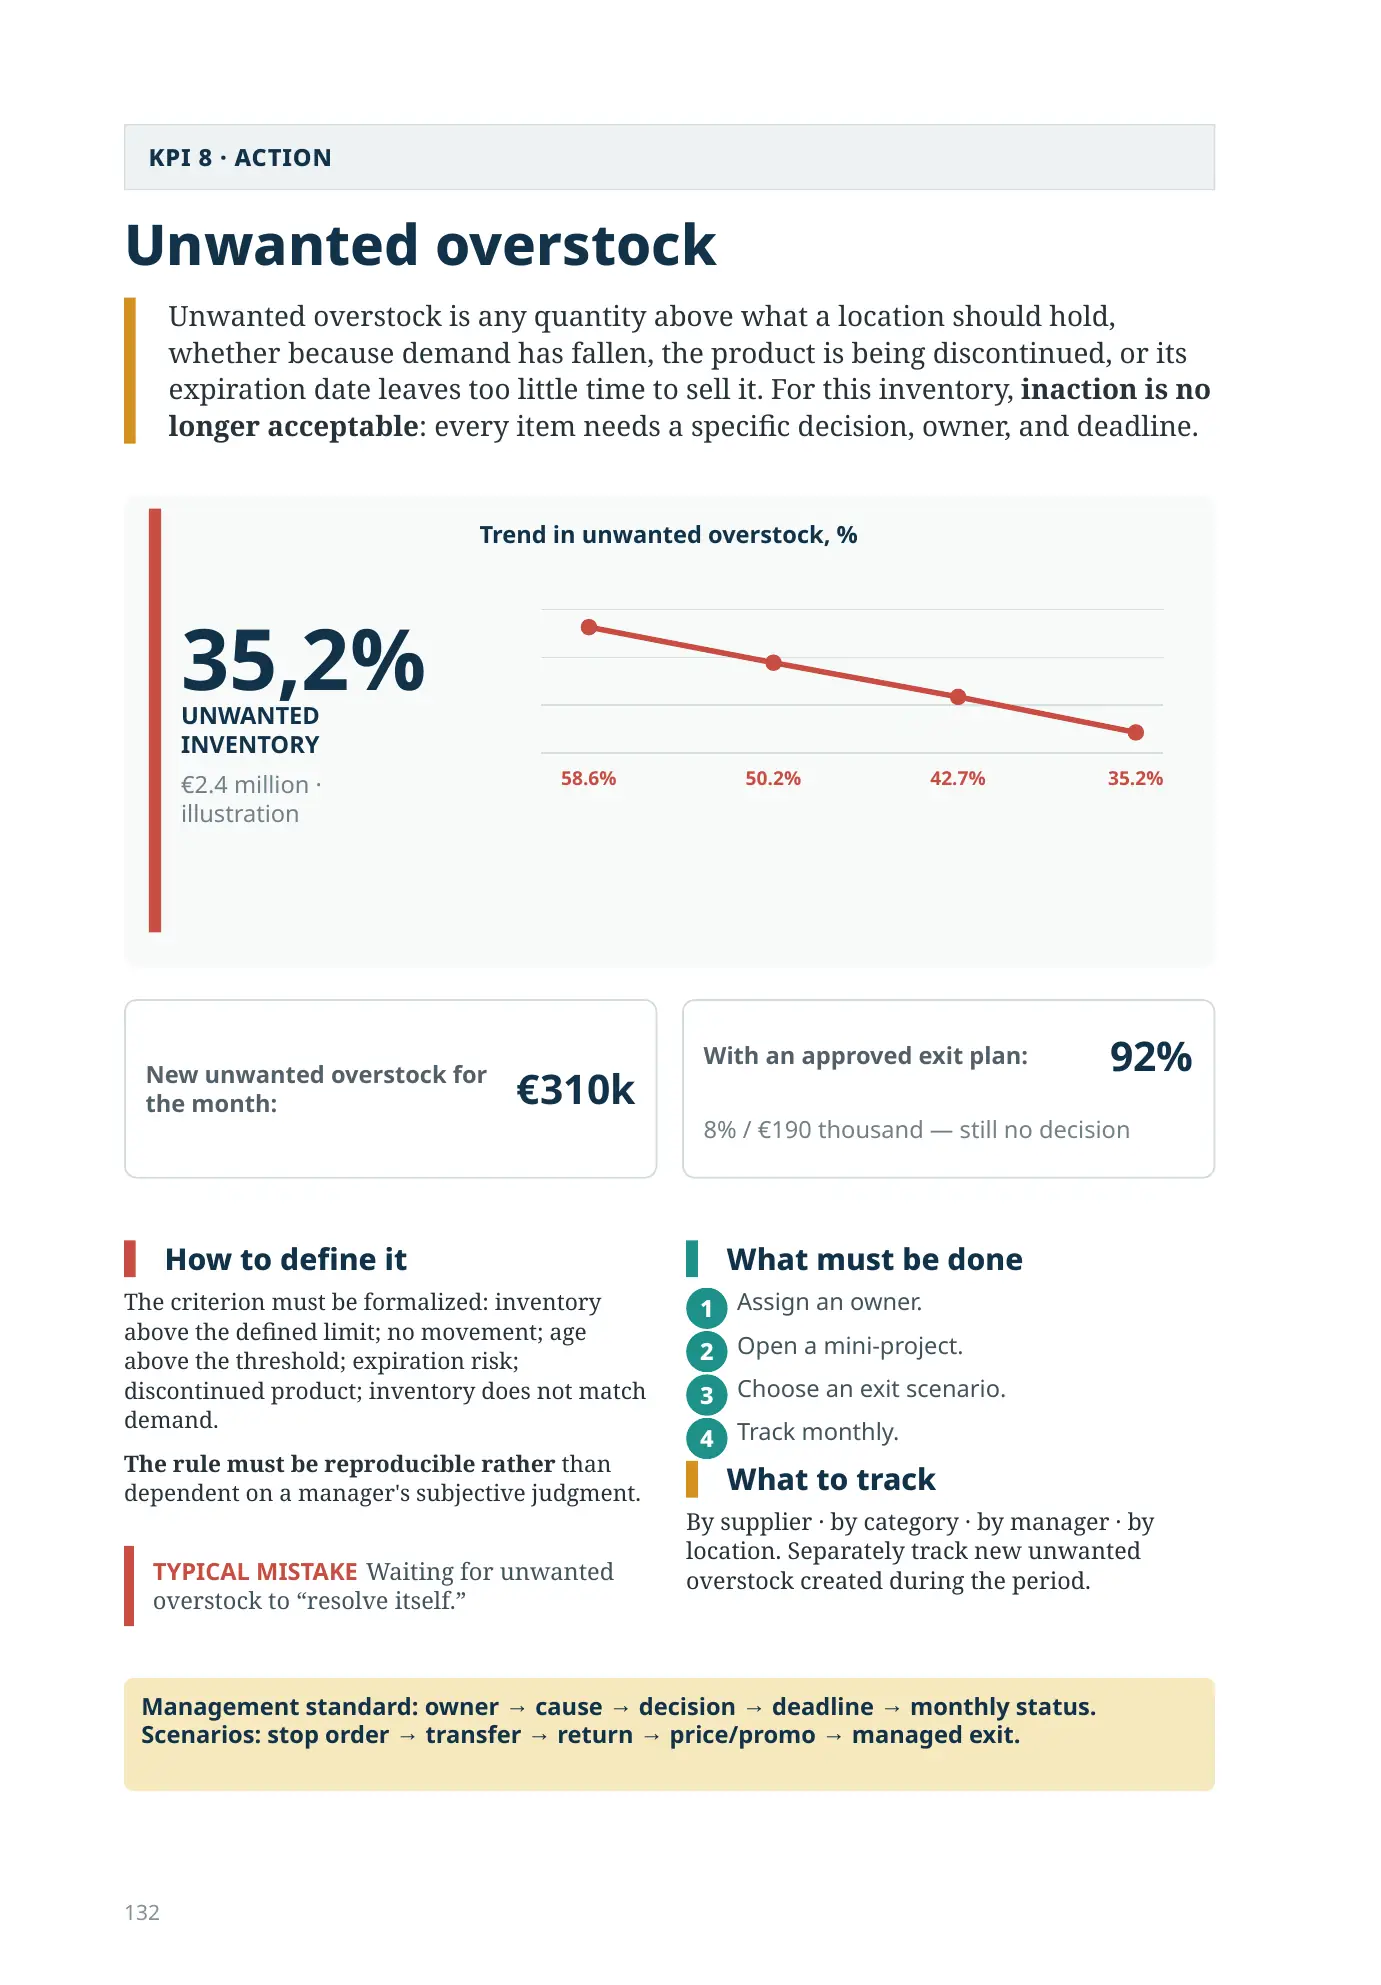
Unwanted overstock is any quantity above what a location should hold, whether because demand has fallen, the product is being discontinued, or its expiration date leaves too little time to sell it. For this inventory, inaction is no longer acceptable: every item needs a specific decision, owner, and deadline.
INVENTORY€2.4 million · illustration
Trend in unwanted overstock, %
How to define it
The criterion must be formalized: inventory above the defined limit; no movement; age above the threshold; expiration risk; discontinued product; inventory does not match demand.
The rule must be reproducible rather than dependent on a manager's subjective judgment.
What must be done
- Assign an owner.
- Open a mini-project.
- Choose an exit scenario.
- Track monthly.
What to track
By supplier · by category · by manager · by location. Separately track new unwanted overstock created during the period.
Not eight reports. One management conversation
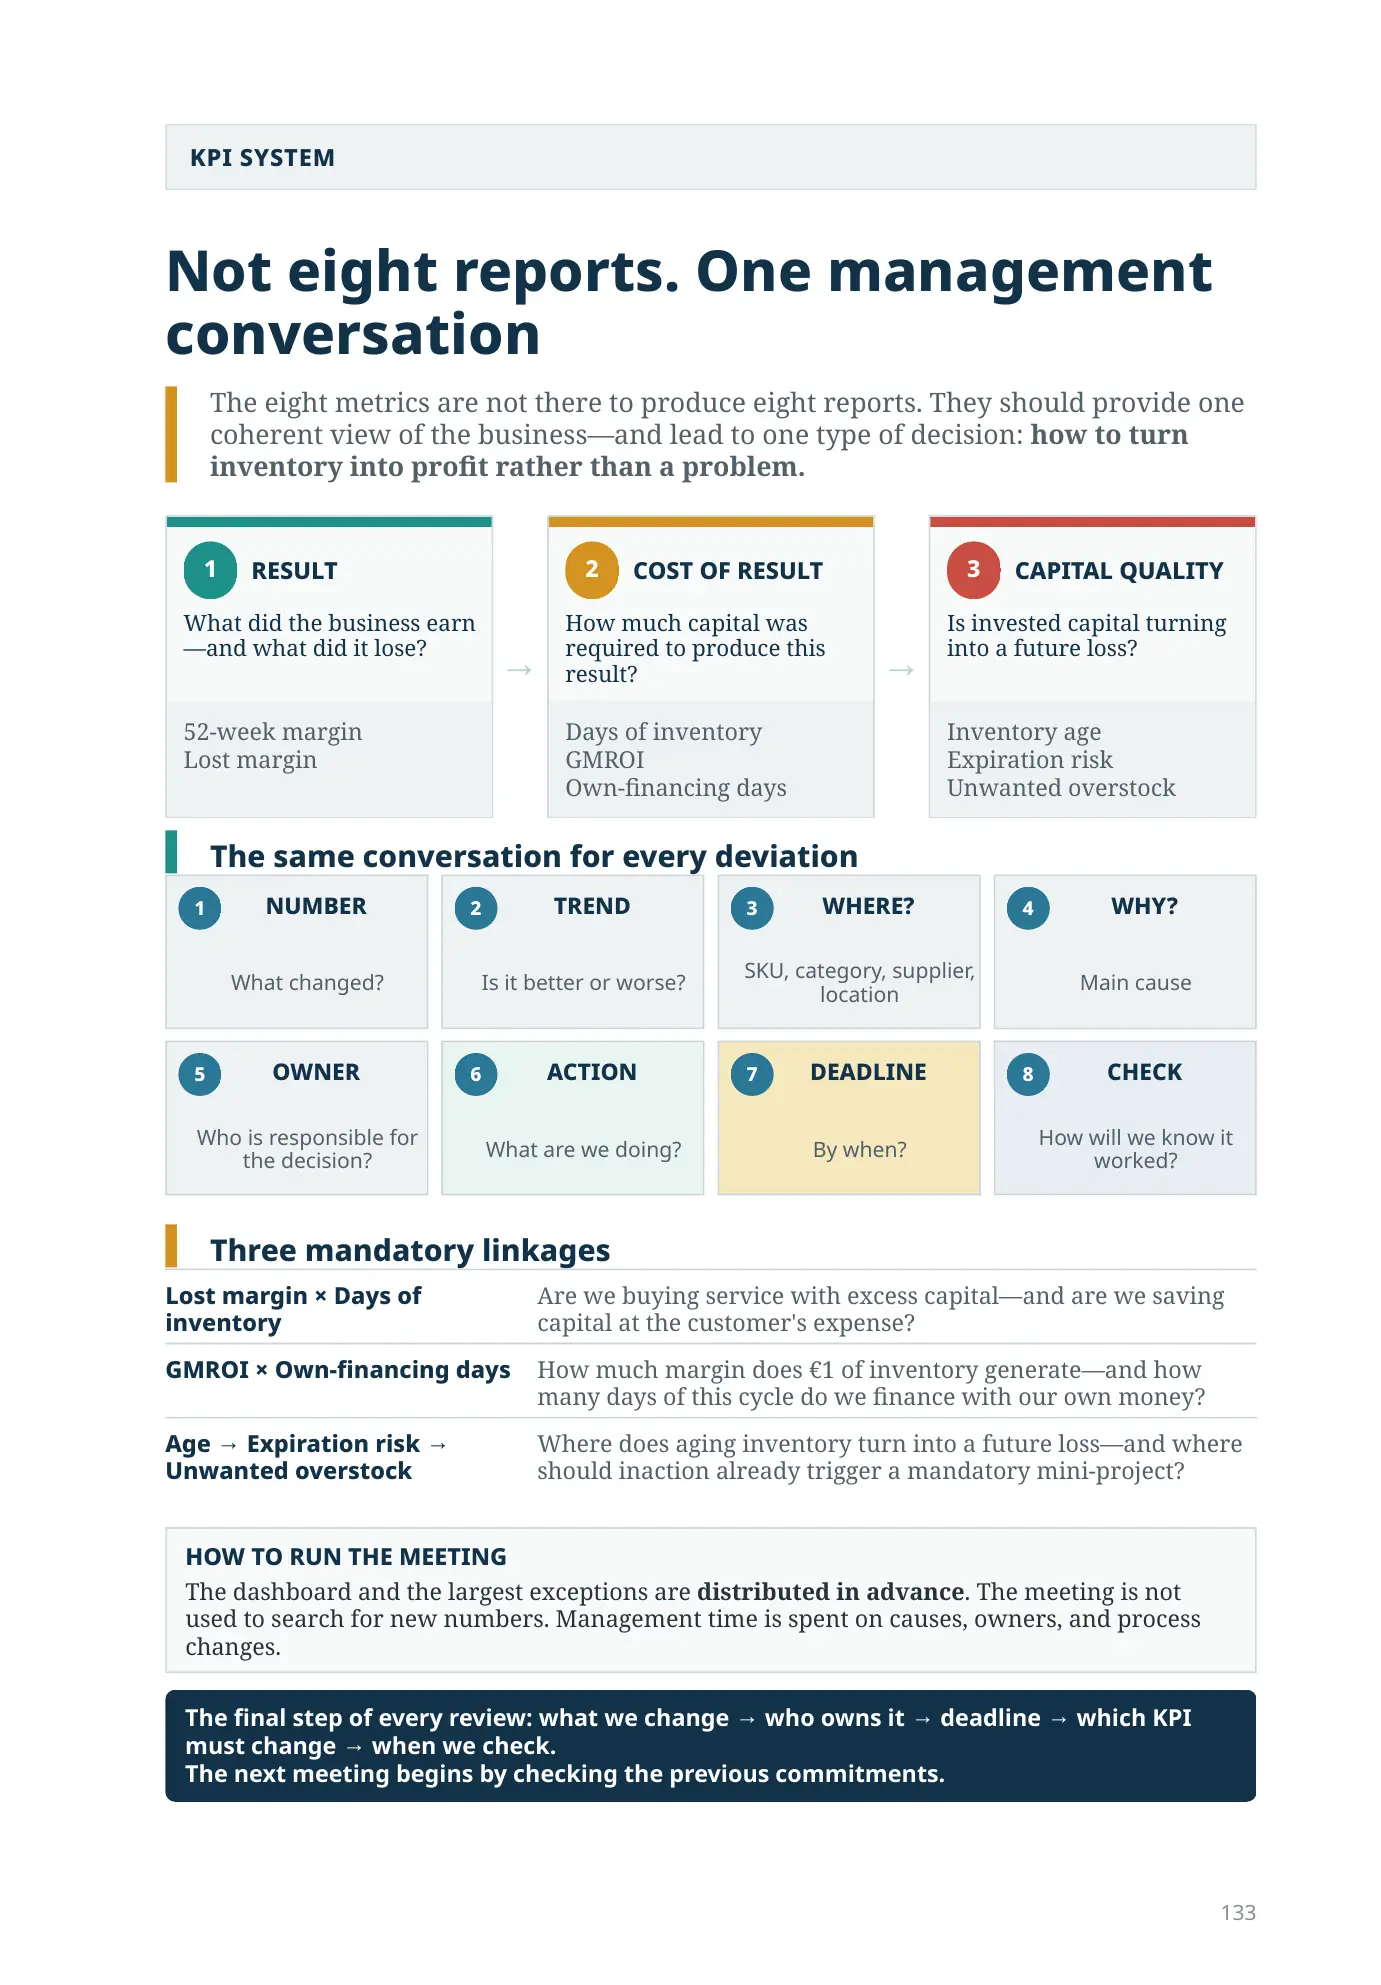
The eight metrics are not there to produce eight reports. They should provide one coherent view of the business—and lead to one type of decision: how to turn inventory into profit rather than a problem.
What did the business earn—and what did it lose?
52-week marginLost margin
How much capital was required to produce this result?
Days of inventoryGMROI
Own-financing days
Is invested capital turning into a future loss?
Inventory ageExpiration risk
Unwanted overstock
The same conversation for every deviation
Three mandatory linkages
The dashboard and the largest exceptions are distributed in advance. The meeting is not used to search for new numbers. Management time is spent on causes, owners, and process changes.
The next meeting begins by checking the previous commitments.
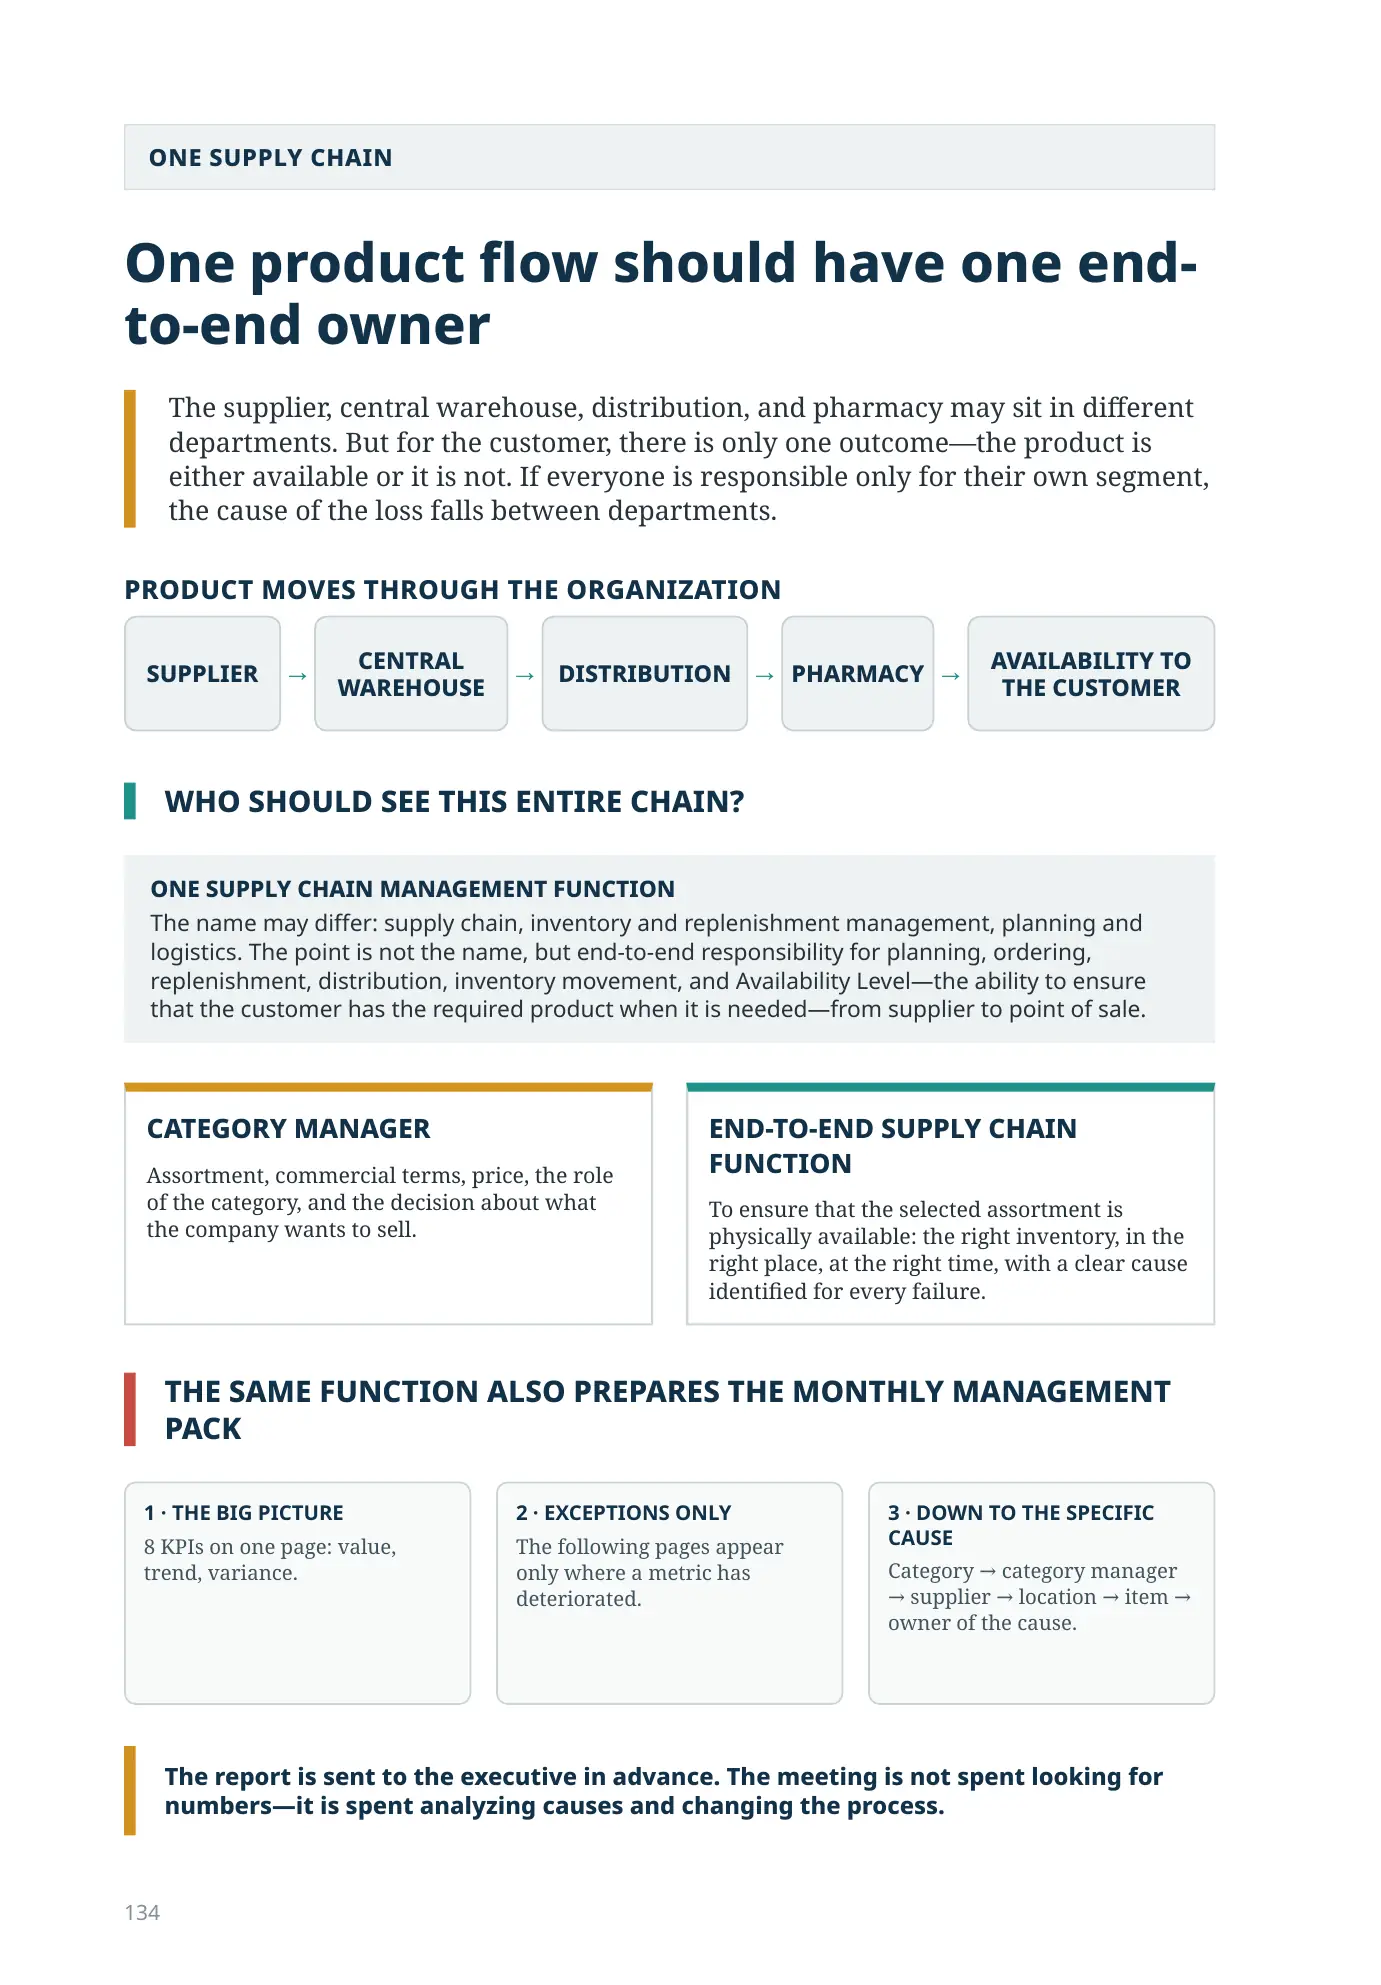
ONE SUPPLY CHAIN
One product flow should have one end-to-end owner
The supplier, central warehouse, distribution, and pharmacy may sit in different departments. But for the customer, there is only one outcome—the product is either available or it is not. If everyone is responsible only for their own segment, the cause of the loss falls between departments.
WHO SHOULD SEE THIS ENTIRE CHAIN?
ONE SUPPLY CHAIN MANAGEMENT FUNCTION
The name may differ: supply chain, inventory and replenishment management, planning and logistics. The point is not the name, but end-to-end responsibility for planning, ordering, replenishment, distribution, inventory movement, and Availability Level—the ability to ensure that the customer has the required product when it is needed—from supplier to point of sale.
CATEGORY MANAGER
Assortment, commercial terms, price, the role of the category, and the decision about what the company wants to sell.
END-TO-END SUPPLY CHAIN FUNCTION
To ensure that the selected assortment is physically available: the right inventory, in the right place, at the right time, with a clear cause identified for every failure.
THE SAME FUNCTION ALSO PREPARES THE MONTHLY MANAGEMENT PACK
The report is sent to the executive in advance. The meeting is not spent looking for numbers—it is spent analyzing causes and changing the process.
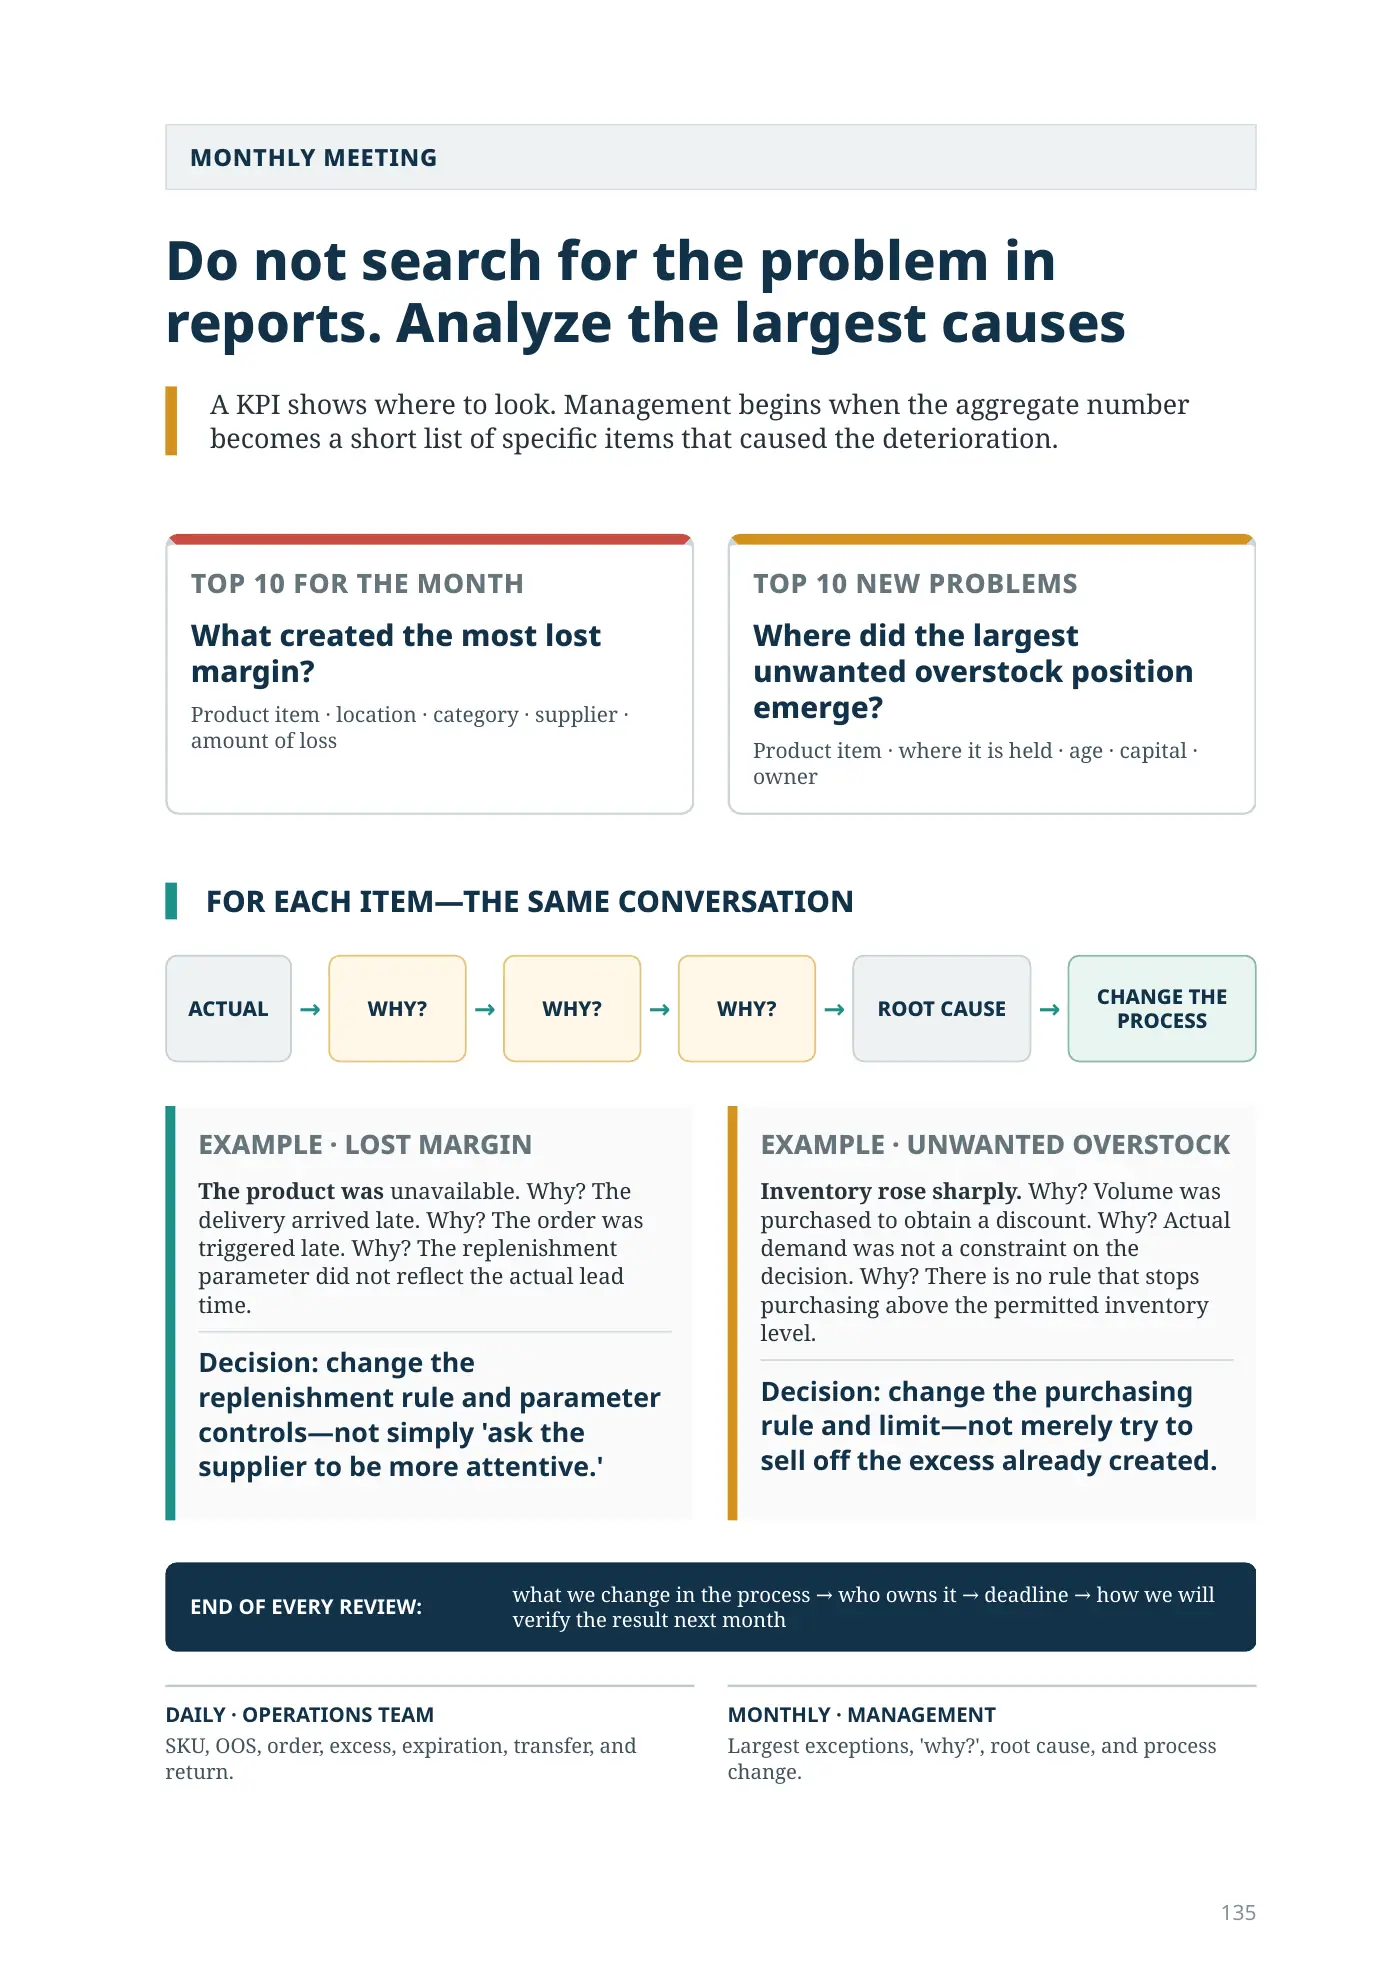
MONTHLY MEETING
Do not search for the problem in reports. Analyze the largest causes
A KPI shows where to look. Management begins when the aggregate number becomes a short list of specific items that caused the deterioration.
TOP 10 FOR THE MONTH
What created the most lost margin?
Product item · location · category · supplier · amount of loss
TOP 10 NEW PROBLEMS
Where did the largest unwanted overstock position emerge?
Product item · where it is held · age · capital · owner
FOR EACH ITEM—THE SAME CONVERSATION
EXAMPLE · LOST MARGIN
The product was unavailable. Why? The delivery arrived late. Why? The order was triggered late. Why? The replenishment parameter did not reflect the actual lead time.
Decision: change the replenishment rule and parameter controls—not simply 'ask the supplier to be more attentive.'
EXAMPLE · UNWANTED OVERSTOCK
Inventory rose sharply. Why? Volume was purchased to obtain a discount. Why? Actual demand was not a constraint on the decision. Why? There is no rule that stops purchasing above the permitted inventory level.
Decision: change the purchasing rule and limit—not merely try to sell off the excess already created.
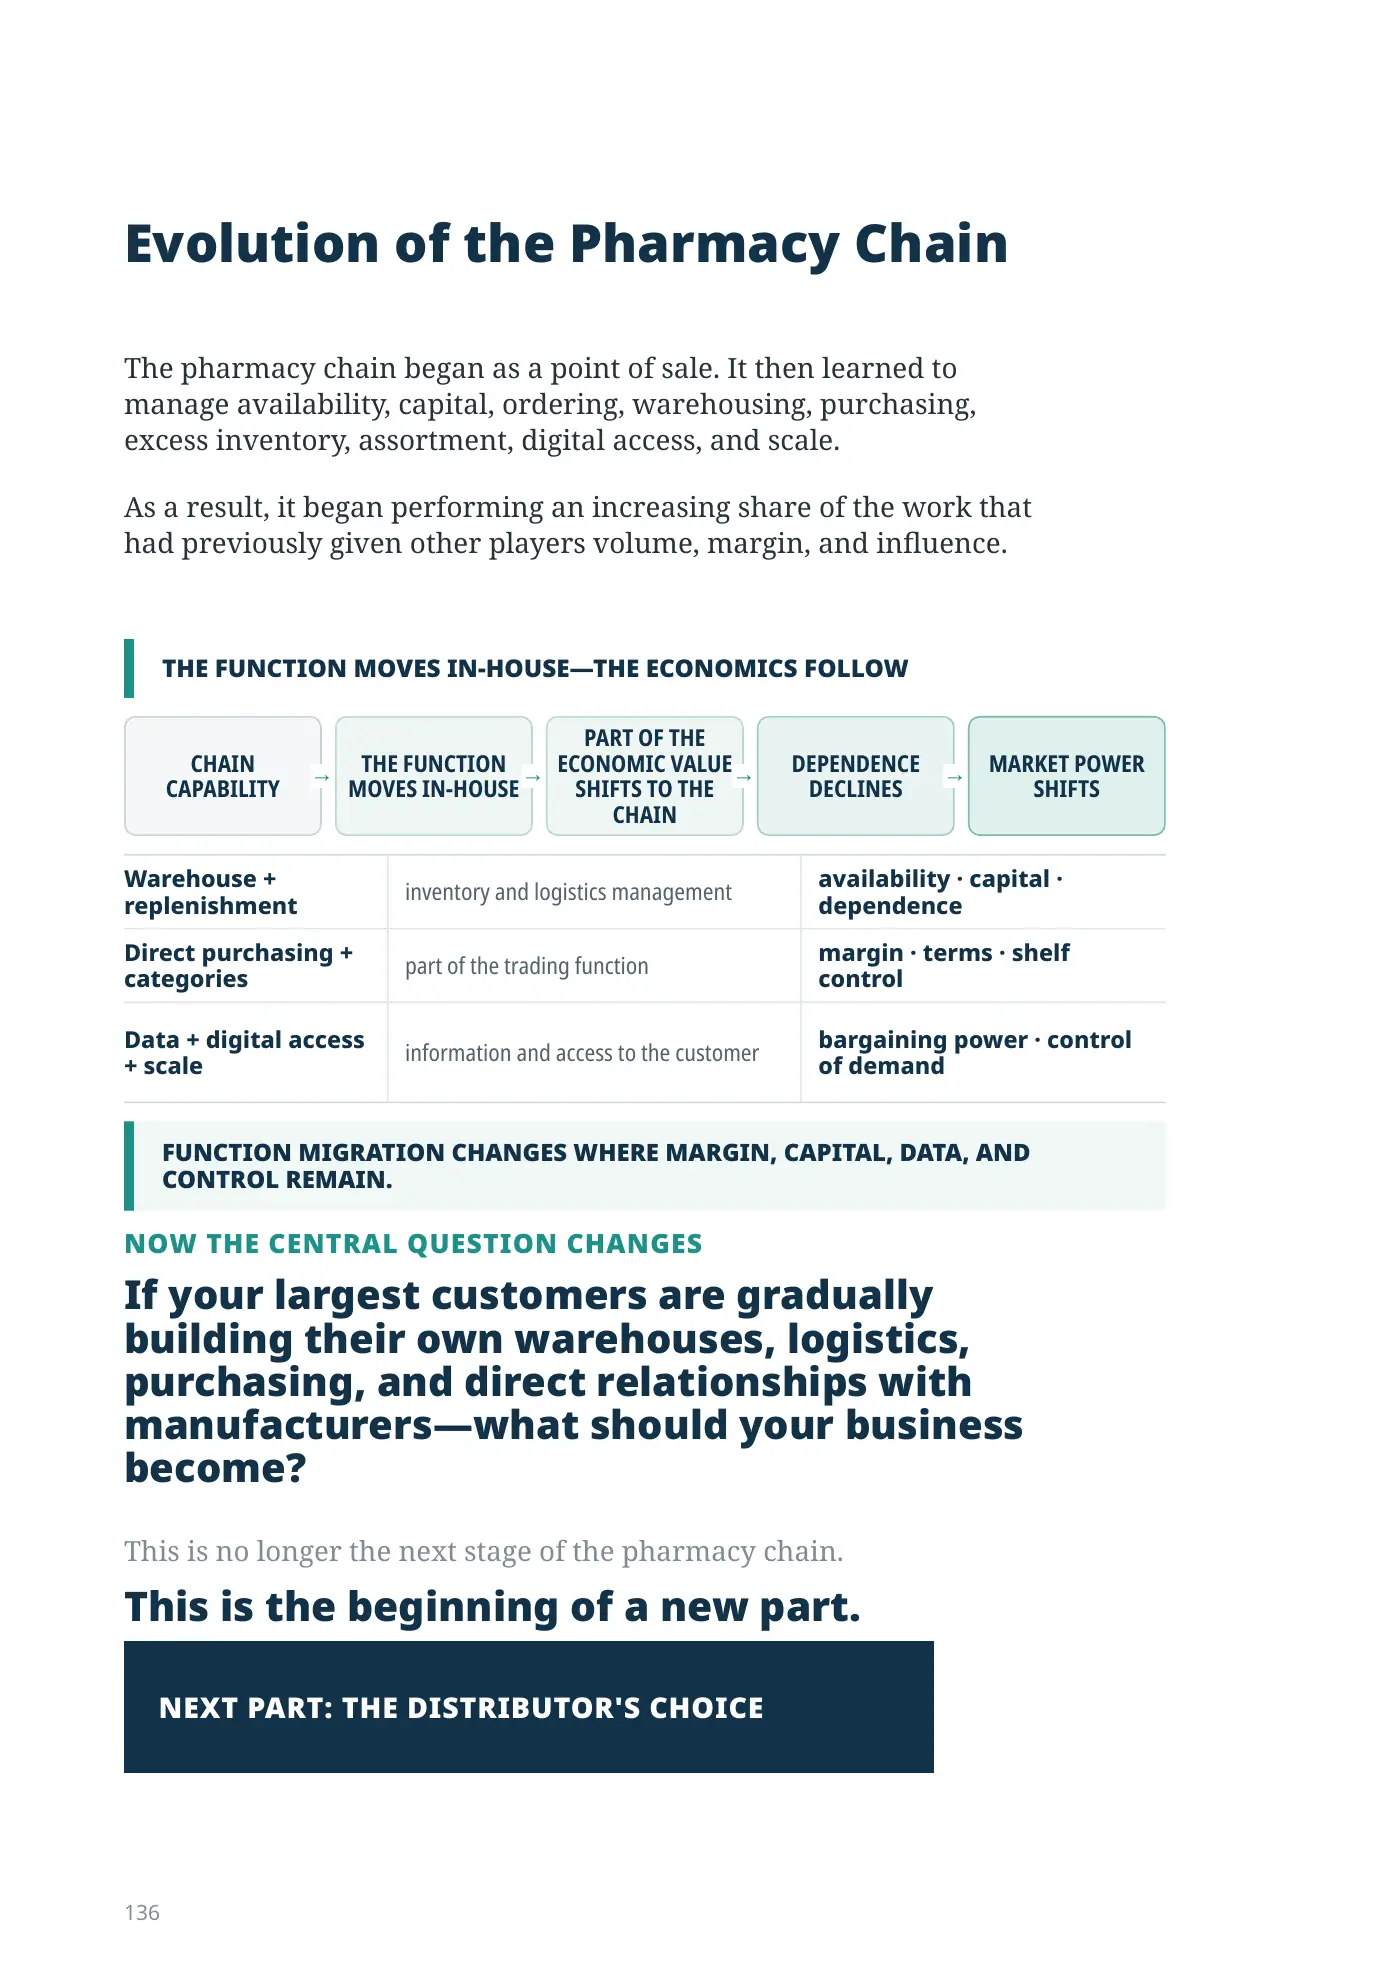
Evolution of the Pharmacy Chain
The pharmacy chain began as a point of sale. It then learned to manage availability, capital, ordering, warehousing, purchasing, excess inventory, assortment, digital access, and scale.
As a result, it began performing an increasing share of the work that had previously given other players volume, margin, and influence.
THE FUNCTION MOVES IN-HOUSE—THE ECONOMICS FOLLOW
FUNCTION MIGRATION CHANGES WHERE MARGIN, CAPITAL, DATA, AND CONTROL REMAIN.